U.S. banks are reducing, repositioning branches

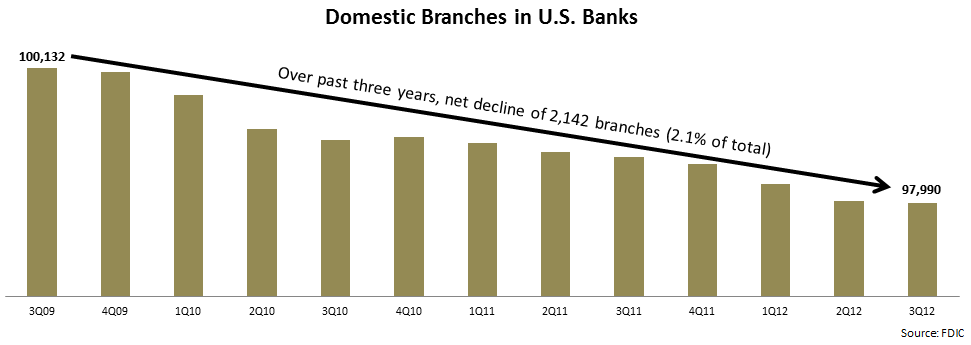
An EMI analysis of recently-published quarterly bank data by the FDIC found that U.S. banks are continuing to reduce branch numbers.

U.S. branches are very heavily concentrated in a limited number of banks:

  • Just 50 banks (<1% of all banks) hold more than than half of all branches (51%).
  • More than 6,100 banks (93% of all banks) have five or fewer branches.  And, of these, more than 1,400 branches have just one branch.

Bank branch numbers change based on bank merger-and-acquisition activity, purchase and sale of portions of branch networks, as well as organic growth.

  • Over the past year, the vast majority of banks (83%) did not change branch numbers.
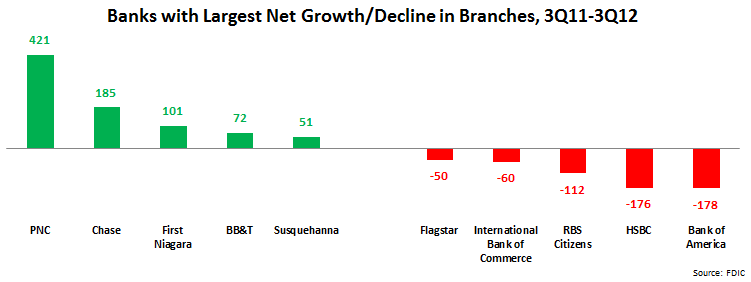
  • 548 banks (8% of all banks) grew their networks by a total of 2,359 branches.  PNC had the largest growth (+421 branches), largely due to its acquisition of RBS Bank as well as an Atlanta branch network from Flagstar Bank.  Chase also had strong growth (+185 branches), driven by organic growth in key expansion markets like California and Florida.
  • 609 banks (9% of the total) reduced their branch networks by a total of 3,092 branches.  Aside from bank sales/closures, the bank with the largest decline was Bank of America, which is in the process of cutting its branch numbers by 10-15%.

Even following the reduction in branch numbers, there are almost 98,000 bank branches in the U.S., so clearly the branch channel is not going away anytime soon.  However, more and more customers are gravitating to self-service electronic channels for their everyday banking needs, so a reassessment of branches’ traditional role is needed.  At the same time, branches have untapped potential as sales, advice and marketing channels.  The following are some key areas that banks need to focus on to both right-size their branch networks and equip these branches to realize their full sales, service and marketing potential:

  • Network density.  Banks will need to determine optimal branch density in key markets, in order to maintain a significant physical presence, and deter competitive market entry, while avoiding significant overlap between branch catchment areas.
  • Branch size. Less traffic in branches will necessitate smaller branches in some markets.  Some banks are already creating a variety of branch formats to reflect different market opportunities (as defined by market profiling that covers information like the number/projected growth of people and businesses within a radius of the branch, the bank’s overall strength in the market, as well as competitive intensity).
  • Branch design.  The design and layout should reflect branches’ new sales and advisory role, with less space for teller counters, and a layout more conducive to staff-customer face-to-face interaction.  Recognizing that branches play an important branding and PR role for the banks, many banks are redesigning branches to convey a more customer-friendly image and promote connections with the local community.
  • Staffing. Again, the changing role of the branch will mean that there will a reduced need for tellers with a greater role for specialists, such as mortgage bankers, investment advisors and small business bankers.  Staff training and support tools will need to reflect their new roles in the branch.
  • Technology and channel integration. As banks change the design and staffing of branches, they are incorporating technology to showcase new products and services, connect with remote staff (e.g., using videoconferencing in the branch to connect to financial advisors), and promote other bank channels (Bank of America is using QR codes in teller counters to enable customers to download its mobile banking app.)
FDIC Credit Card Data: Slight Rise in Loans, Continued Decline in Charge Offs

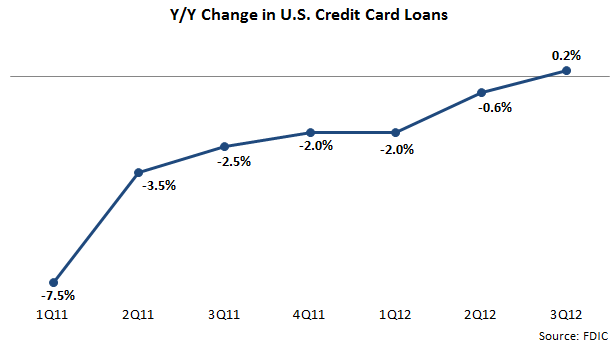
The latest U.S. bank data published by the FDIC reveals that the protracted decline in credit card outstandings may be coming to an end, charge-off rates are continuing to fall, and credit card line utilization rates are relatively unchanged.

  • Between end-3Q11 and end-3Q12, credit card outstandings rose by 0.2%.  This small increase follows a steady series of y/y declines in the years following the financial crisis.  The largest three issuers (Chase, Bank of America and Citibank), which still account for more than half of outstandings, reported a 7% y/y decline, as charge-offs and portfolio sales continue to outstrip new loan growth.  On the other hand, large regional banks (see note at the bottom of the blog) increased outstandings 6% y/y, led by TD Bank (+22%) and SunTrust (+19%).  Looking into 2013, it is likely that outstandings will grow modestly as regional banks and, to a lesser extent, “monolines” pursue loan growth, and as the top three issuers move towards the end of their portfolio deleveraging.  However, much will depend on the demand for credit.  This demand is significantly influenced by macroeconomic trends and consumer confidence, both of which are fragile at present.

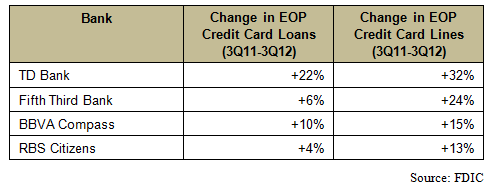
  • Credit cards lines fell 2% in the year to end-3Q12.  The top three issuers reduced card lines by 6% while regional banks increased lines by 8%.  Movements in credit cards lines tend to match outstandings very closely.  In 3Q12, credit card utilization (credit card outstandings as percentage of credit card lines) was 21.5%, and this measure has remained in the 20.5%-22.5% range in recent years.  This consistent credit card utilization ratio implies that if issuers increase credit card lines, outstandings growth will follow.  The following table highlights some regional banks that have grown credit card lines over the past year at double-digit rates:

  • Credit card issuers continue to benefit from reductions in charge-offs, which fell 31% in the year to end-3Q12.  The average charge-off rate fell 174 basis points (bps) y/y and 12 bps on a linked-quarter basis, to 4.04% in 3Q12.  Charge-off rates are now at or below historic averages for many leading issuers, and are not expected to fall much further.  In fact, as issuers look to build outstandings and grow revenues in 2013, there may be some upward pressure on charge-off rates, depending on how aggressively issuers open the lending spigot.

(Note: Regional bank category includes the following banks: Bank of the West, BB&T, BBVA Compass, BMO Harris , Fifth Third, PNC, RBS Citizens, Regions, SunTrust, TD Bank, U.S. Bank, and Wells Fargo.)

U.S. C&I Loan Trends in Latest FDIC Data

A recent EMI blog post highlighted commercial loan portfolio trends in the third quarter 2012 financial results for leading U.S. banks.  Building on this, EMI analyzed recently-published FDIC data to gain insights into commercial loan portfolio trends for all U.S. banks:

  • Larger banks are generating stronger C&I loan growth than smaller banks.  According to the FDIC, total C&I loans rose 15% between end-3Q11 and end-3Q12.  Banks with more than $1 billion in assets increased C&I loans by 16%.  Banks with less than $1 billion in assets grew C&I loans by only 3% (banks with less than $100MM in assets actually reported a 1% decline in C&I loans).

  • Larger banks have a higher C&I loan concentration. C&I loans account for 20% of total U.S. bank net loans.  Not surprisingly, C&I loan concentrations are higher in banks with more than $1 billion in assets (21%) than in banks with less than $1 billion in assets (13%).
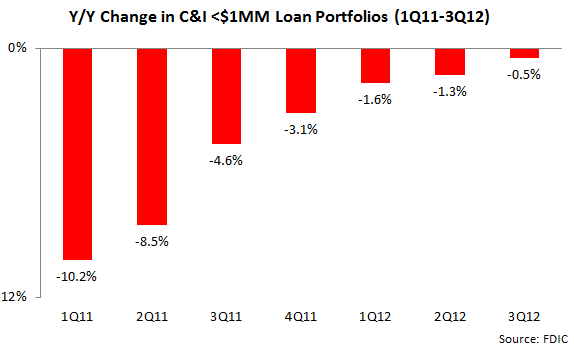
  • Declines in small business loan portfolios are starting to bottom out. Small business loan portfolios (defined as C&I loans of less than $1 million) fell by 0.5% in the year to end-3Q12.  However, the rate of decline has been slowing, as originations/renewals start to catch up with charge-offs/expirations.