Customer Segment Intelligence Delivers Balance to Your Customer Success Initiatives

In customer success management, there will always be a tension between treating each customer as special and unique in order to ensure their success, and serving all customers without exploding the CSM team budget. One way to strike a balance between these two poles is the collection, maintenance, and efficient utilization of customer segment intelligence.

Customer segment intelligence is the knowledge base of elements relevant to the sale and utilization of your product/service by companies within a target segment. These elements would likely include:

  • Key “firmographic” attributes of companies in the segment (e.g., size, geography) that might influence purchase and adoption
  • Market trends
  • Decision-making structures and influence networks
  • Typical needs and objectives related to your product/service
  • Propensity for and approach to technology adoption
  • Common objections to purchase
  • Common obstacles to implementation/utilization

Equipped with this kind of intelligence, SaaS companies can develop segment-specific customer success programs and segment “playbooks” that will produce better results more efficiently.  They achieve this by being adapted to align with the particular characteristics and meet the particular needs of companies in that segment. A “one-size-fits-all” onboarding program is almost always better than no onboarding program is likely to miss the mark for some customers.  A custom implementation plan is highly effective but unscalable.  A customer segment intelligence-based onboarding program strikes a balance between these extremes by delivering a template that applies to a group of customers, but is effective because it is built on the foundation of knowledge of the typical operational constraints on the companies’ ability to get quickly to value and capture quick wins.

As is the case with the aforementioned onboarding, most customer success initiatives benefit from segment intelligence. For example, it is much more effective and efficient to have a series of segment email templates for cross-selling and/or up-selling rather than each CSM writing new emails from scratch for every upsell/cross-sell opportunity and rather than using a single, generic “canned” email that fails to be compelling because it doesn’t speak to the specific segment needs. Similarly, understanding when breadth or depth of utilization should register either as a concern (too low) or an opportunity (very high) requires knowledge of the relevant segment-specific benchmarks rather than benchmarks based on the entire customer base, much of which may behave very differently than the customers in one specific segment.

Moreover, this intelligence delivers further operational efficiency gains by enabling lesser-tenured CSMs to ramp up and effectively help customers faster. Playbooks, templates, and diagnostics provide a foundation of proven tools and process that gives newer CSMs with good relationship-building skills the opportunity to succeed quickly.

In an upcoming blog, we will discuss best practices for gathering and distributing customer segment intelligence.
Tentative Recovery in U.S. Credit Card Lending Continues in 1Q13

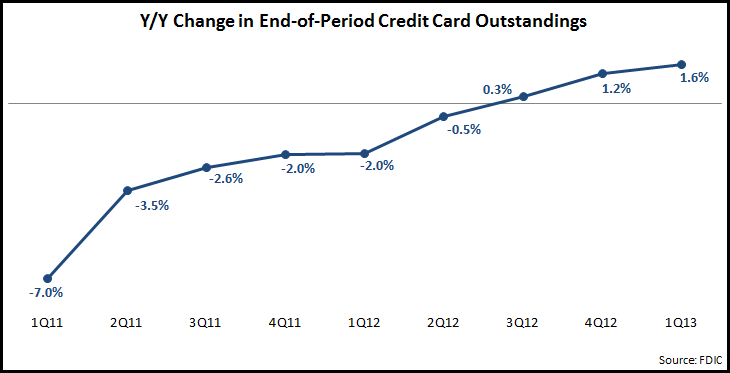
EMI’s analysis of recently-published U.S. bank data by the FDIC reveals that credit card outstandings rose 1.6% y/y to the end of 1Q13.  Outstandings have been recovering in recent quarters, following a protracted period of declines as a result of the 2008 financial crisis.  In addition, net credit card charge-offs continue to decline, falling 12% y/y in 1Q13.

Our analysis also finds that:

  • 1,238 U.S. banks (19% of the total) have card assets, with 6% of banks having more than $1 million in card assets.  55 banks have more than $100 million in outstandings, with just 23 banks holding more than $1 billion in credit card loans.
    • Of the 55% with more than $100 million in assets, 31(56%) reported increases in their credit card loan portfolios between end-1Q12 and end-1Q13
  • The three largest credit card issuers–Citibank, Chase and Bank of America–all continued to report credit card loan declines, as they continue to deleverage.  The cumulative decline for these three issuers was 5%.
  • The former “monolines”–American Express, Discover and Capital One–all increased outstandings.  Capital One reported a 44% increase, largely due to the acquisition of the HSBC card portfolio.  American Express grew credit card loans 6%, with Discover’s outstandings rising by 7%.
  • Many regional banks continued to increase credit card lending, albeit from significantly lower bases than their national bank counterparts.

These trends in credit card outstandings–slow overall growth, declines among the big three issuers, growth for monolines and regional banks–are consistent with industry predictions that EMI published in a blog earlier this year.

Large banks continue to dominate U.S. commercial lending

EMI analysis of the latest FDIC U.S. bank data for the first quarter of 2013 reveals a number of interesting trends in commercial and industrial (C&I) and small business lending:

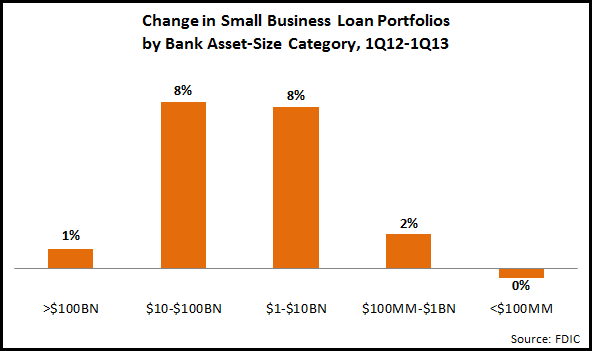
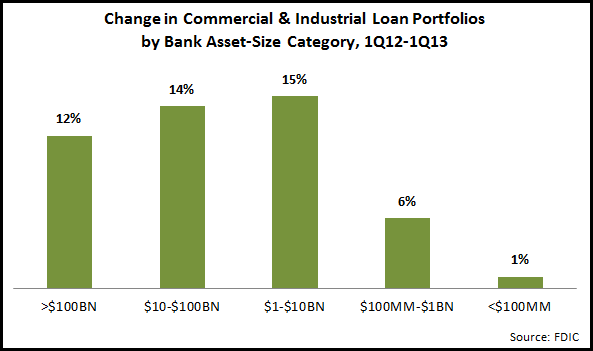
  • U.S. banks’ C&I loan portfolios continued to grow at double-digit rates year-on-year (y/y) in 1Q13, rising 12%, the same rate of increase as in 4Q12.  Commercial loan growth continues to outpace overall loan growth of 4% y/y.  Small business loan portfolios (defined as C&I loans with values of less than $1 million) are finally showing signs of life, rising 2% y/y.  This follows a 0.4% y/y increase in 4Q12, which was the first such increase in years, as reported in a February 2013 EMI blog post.
  • Large banks dominate C&I lending.  Of the 6,500 banks in the U.S., just 17 have more than $100 billion in assets.  But these 17 banks account for 57% of total loans and 60% of C&I loans.  In addition, the large banks (with assets of more than $1 billion) are reporting stronger growth in their C&I loan portfolios than their smaller counterparts.

  • Among the top 20 C&I loan portfolios, banks reporting above-average growth include:
    • HSBC Bank USA (+27%)
    • Bank of America (+22%): representing a significant growth rate for the bank, which has trailed other leading national banks for loan growth in recent years.  The bank reported in the Financial Times in February 2013 that it was increasing investment in its commercial bank, including the addition of 50 bankers as a first step.
    • Sovereign Bank (+21%)
    • Fifth Third (+17%): benefiting from a focus on specific vertical markets, including the establishment of a new energy lending unit in late 2012.  (See an EMI blog post from February 2013 on driving commercial loan growth through vertical industry targeting.)
    • BB&T (+17%)
    • KeyBank (+16%)
  • Turning to small business loans, smaller banks with less than $1 billion in assets have a greater share of this market, accounting for 23% of all small business loans (compared to 11% of total loans).  However, these banks trail the larger banks in terms of small business loan growth, and will need to reposition themselves (in areas like personal service and local presence) to capture a good share of any continued recovery in small business lending.

  • The 20 banks with the largest small business loan portfolios grew their small business lending 4% y/y in 1Q13.  Banks with above-average growth included:
    • Ally (+44%)
    • Wintrust (+14%)
    • Huntington (+11%): has focused internal resources by making business loan commitments, as well as deploying additional small business bankers.
    • TCF Bank (+11%)
    • American Express (+9%): built on small business card lending.

See a recent EMI blog for examples of banks that are effectively marketing to their commercial banking clients and prospects.