Leading U.S. Banks’ Commitment to Marketing Investment Continued in 2024
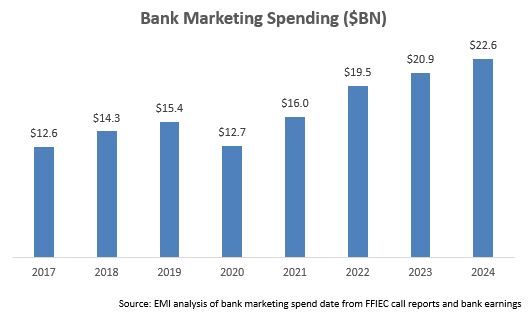
EMI Strategic Marketing performed a detailed analysis of advertising and marketing expenditures for c. 30 leading U.S. banks and found an 8% rise in spend in 2024, reaching more than $22.5 billion. Bank marketing spend was initially negatively impacted by COVID – falling 18% in 2020 – then it rebounded strongly by 26% in 2021 and 22% in 2022. The rate of growth has averaged 8% over the past two years, in line with a 9% CAGR since 2017.
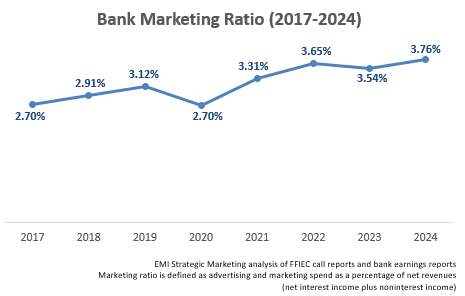
The bank marketing ratio (advertising and marketing spend as a percentage of net revenues) rose by 22 basis points to 3.76% in 2024. This ratio has grown well above pre-pandemic levels.
Traditional banks are investing to build their brands to support expansion into new geographic markets and new financial categories and to counter the growing threat from fintechs
Digital challengers like SoFi and LendingClub have made significant investments in marketing to build brand awareness
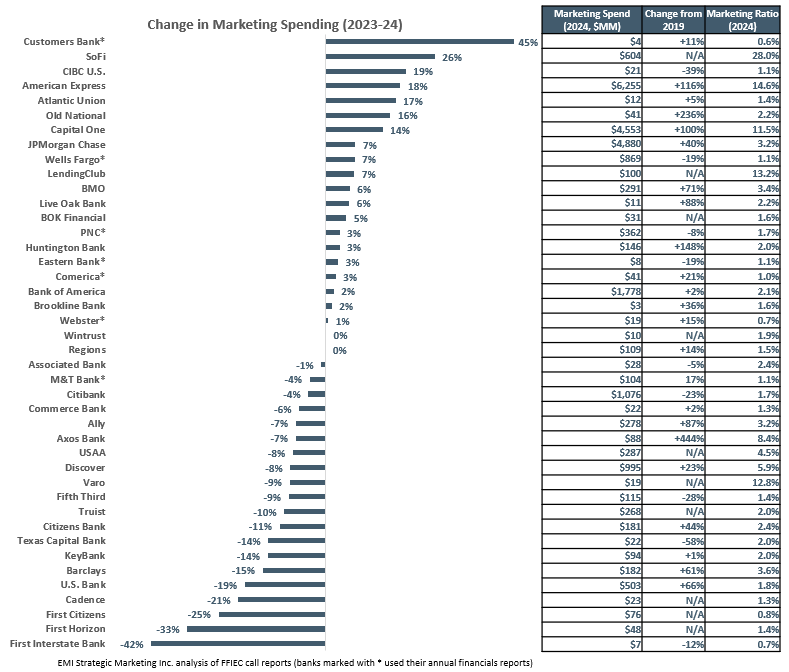
The overall rise in marketing spending was driven by leading financial advertisers like American Express (up 18% to $6.3 billion) and Capital One (up 14% to $4.6 billion). Both banks invested more than 10% of their net revenues on marketing. They were among the five banks – including JPMorgan Chase (up 7% to $4.9 billion), Bank of America (up 2% to $1.8 billion) and Citi (down 4% to $1.1 billion) – that spent more than $1 billion in marketing in 2024.
Although Citi was one of several banks that reduced their marketing budgets in 2024, it is important to apply a longer lens to some of the banks. For example, U.S. Bank reduced its advertising and marketing spend from $623 million in 2023 to $503 million in 2024. However, since its annual spend was less than $400 million between 2018 and 2022, its 2024 spend represents its continued strong commitment to marketing investment. The chart below shows the change in advertising and marketing by banks between 2023 and 2024 and also includes marketing ratios as well as change in spend from the years 2019 (pre-COVID) to 2024. (The extent and timing of advertising campaigns can also impact overall spend levels from year to year.)
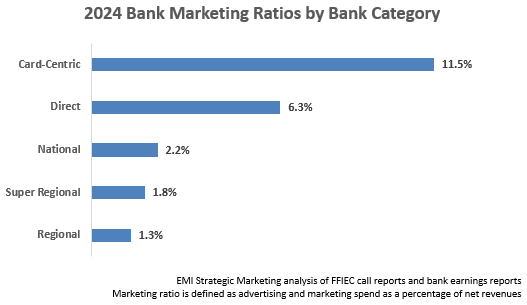
There is a significant difference in marketing ratios between different bank categories:
Card-Centric banks (e.g., American Express, Capital One, Discover) have high marketing ratios as they aggressively market credit cards (and in many cases personal loans) nationally.
Direct banks/fintechs (e.g., SoFi, Ally, Varo) need to build brand awareness in order to market their financial solutions nationally, and do not have the benefits – and the costs – of a branch network.
National banks like JPMorgan Chase and Bank of America look to build their brand across the U.S., while also devoting marketing to support their branch presence.
Super regional and regional banks concentrate more of their marketing resources within their footprints.
For 2025, we expect that bank marketing spending will continue to rise, based on:
Strong macroeconomic conditions
Increased consumer and business confidence
Digital challengers building their brands to raise awareness and win share from traditional banks
Traditional banks investing in established and emerging marketing channels to thwart competitive inroads from digital challengers, support expansion into new markets, and make up for the scaling back of branch networks in existing markets
Follow the Path: Addressing Financial Services B2B Marketer’s Measurement Problem
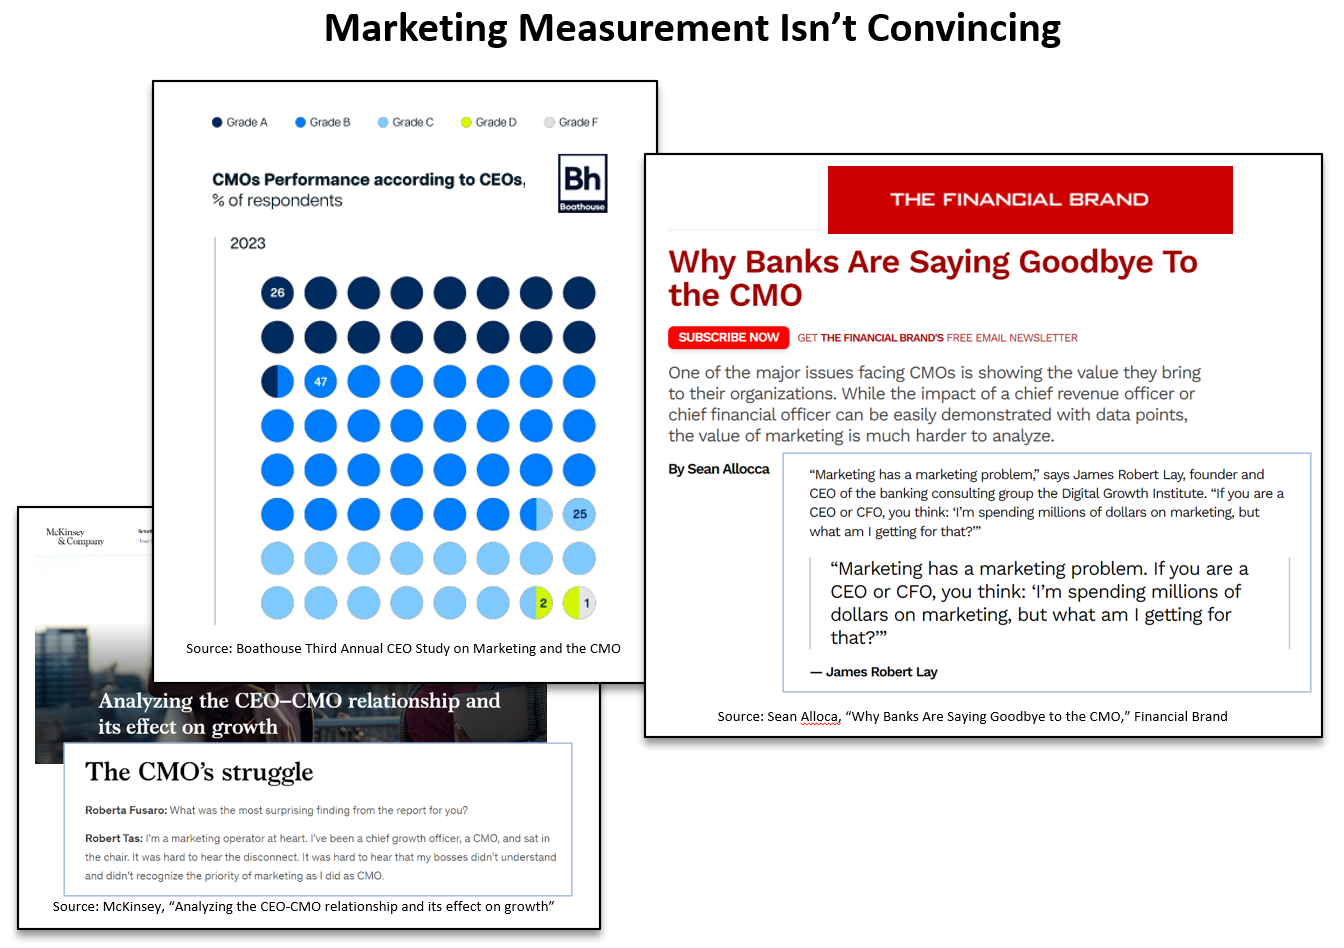
Financial services B2B marketers have a measurement problem. It seems like every few weeks a new article appears that focuses on a deteriorating relationship between CEOs and CMOs, often driven by concerns from the former about the latter’s ability to drive growth. Giving marketers the benefit of the doubt, I’d argue this is less a case of ability than demonstration.
In the CMOs’ defense, most other functions are clearly aligned with revenue generation (product, sales) or expense management (customer service, administration), but marketers are a lot like the high school outcasts who don’t play a sport or get good grades. And they don’t even have theater as a third option.
Yes, marketing is typically aligned with revenue generation. But the reality is that making the case that marketing drives revenue will almost always be a losing proposition. Here’s why: when marketers focus on measuring performance at the BEGINNING of the sales process, they encounter senior executives who don’t see a clear connection to the downstream deals; when they focus on building models that give them credit for the END of the sales process, they get skepticism about anything that reduces the primacy of the sales team. Is it any wonder, then, that the first thing that business leaders do when times are tight is to push marketing to manage expenses?
Well, I’ve got some advice for marketers struggling to find a way to measure their impact: Focus on the journey, not the destination. Philosophers from Lao Tzu to Emerson to Aerosmith’s Steven Tyler have highlighted the importance on finding value in each step along a path, and marketers would be wise to approach measurement with the words of these sages in mind.
For those with a mindset more pragmatic than philosophical, this means considering the value of the marketing activities that move prospective buyers down a path towards purchase.
Two Paths
Think about the last time you made a purchase decision for your business. You probably went through a journey of figuring out your needs and then researching and evaluating options before you were ready to say “yes.” Along the way—whether you were aware of it or not—there were likely a multitude of “microdecisions” that affected the next step you took and, ultimately, where you ended up. At the same time, there was likely a salesperson who was doing their job and trying to guide you towards purchasing from them.
While it may seem counter-intuitive, thinking about measuring the impact of marketing actually needs to start with these two paths—that of the buyer and that of the salesperson—rather than with marketing. The reason for this is that marketing’s job is to generate revenue opportunities. Some who read those words might say “well, then, why wouldn’t you measure success by revenue or Marketing’s contribution to revenue?” Don’t get me wrong: I’m not completely opposed to that idea…but, in my experience, B2B marketers will almost always have a tough time convincing their sales colleagues that some portion of revenue can be directly attributed to Marketing.
So instead, I propose to take each of those three words above—Generate, Revenue, Opportunities—very seriously and literally. “Generate” doesn’t mean complete; it means “produce.” “Opportunities” likewise doesn’t mean closed deals; it means viable deal prospects. Ok, “revenue” means “revenue,” but that’s important because it firmly grounds marketing in the goal: sales. Viewing marketing as the process of producing viable prospects for deals leads you scrutinize the two paths (buying and selling) that result in sales. You have to measure marketing effectiveness by its ability to drive progress down those paths.
Mapping the Paths
I don’t subscribe to the “there’s no marketing funnel anymore” chatter. However, I do absolutely believe that there isn’t a single path that all prospects follow to get to a purchase. So, how can marketing know if it’s driving progress when “progress” will look different for every prospect? For most B2B buying journeys, the answer is that there are key actions that MOST prospects take at some point in the process, e.g., registering on and/or visiting the web site, downloading a sales sheet, scheduling a meeting or a demo. Identify what those key actions are in your situation, and those become your marketing milestones.
For the sales journey, the exercise is very similar. First, you need to find out from the sales team what their milestones are—what are the actions and signals that they look for that can move a prospect from 10% to 30% to 70% probability of sales closure? Some of those may align with the key buyer journey actions, but probably not all. Any sales milestones that aren’t already in the key actions list get added to the marketing milestones list.
Three Real Journeys
There is a vast multitude of ways this approach could be put into action because there are a multitude of potential key actions and sales milestones. But here are three real examples that illustrate the concept:
Visiting a product landing page
Across industries, key product or service information can be delivered in a variety of forms. But in the investment product industry, detailed product information is most often found on a product webpage on the provider web site. Primary research EMI has conducted over the years for clients has consistently shown that visiting product pages is a key part of the investor decision-making process as it is the easiest place to see all of the detailed information (e.g., holdings, strategy, cost, performance) about the product. Moreover, an analysis of product page visit data and money invested in the products showed a correlation between the two. Finally, from the perspective of basic human behavior, there would be little-to-no reason for an investor to visit a product page if they were not looking for a potential product solution.
For these reasons, we identified product page visits as a key buyer action, and therefore defined driving increased product page visits as a marketing KPI. While a product page visit may not always lead to an investment, maximizing product page visits, over time, would have a positive impact on overall purchases.
Going from need to competitor without researching options
Sometimes market research reveals that your problem is that you never had a chance. In the case of a computer hardware component manufacturer, we discovered from in-depth interviews about the purchasing process that buyers immediately went from identifying a need to searching for a solution at the website of the company’s key competitor. The company’s products were never even considered by the buyers, even though they had been exposed to a variety of direct marketing and advertising.
This insight pointed us in the direction of identifying and better communicating with individuals who hadn’t previously responded to any marketing campaigns. While there was no guarantee that all of these unresponsive potential buyers, we reached would end up purchasing, we knew the more of them we reached, the more revenue generating opportunities we would create and the more revenue we would likely capture.
Attending a training session
With the proliferation of subscription-based business models and the increased focus on the lifetime value of customers, important revenue generating opportunities can emerge from your existing customers. What we found at a software company, though, was that pursuing those opportunities required the same marketing focus as new customer acquisition. Specifically, market research identified a strong correlation between attendance at application training sessions and downstream renewals and upselling. While it’s not surprising that customers who were well trained to use the application saw the most value and were the most likely to deliver more revenue, the research data was a powerful confirmation of this intuition. This insight led to a marketing focus on driving training attendance and putting attendance (both the percent who attended and the amount of training per customer) near the top of our marketing KPIs.
Finding the path
The common thread running through these examples—and the key to making this approach to marketing measurement work—is research into decision-making, buying and sales processes. This research is vital not only because it guides you to what to measure, but also because it provides you with the evidence to convince skeptical executives of marketing’s contribution.
So what do you do when senior leadership doesn’t believe that Marketing generates revenue opportunities? Show them the data that say that there’s a correlation between marketing outcomes and revenue, and buttress that with an appeal to everyone’s intuition that visiting a product page or attending training sessions will produce downstream results. Now you’re in a position to highlight the potential detrimental effect of budget cuts because that will have a direct negative impact on the ability of Marketing to deliver those outcomes.
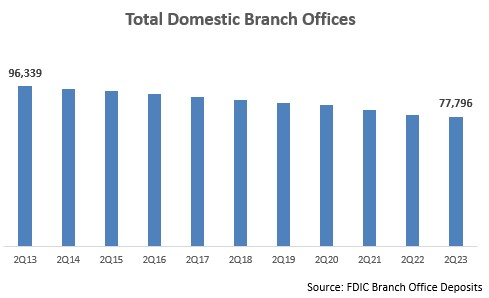
The FDIC recently published detailed branch and deposit data for different geographic levels for all U.S. banks. EMI’s analysis of this data revealed the following trends:
There is a continued (but slowing) decline in the number of bank branches. Over the past 10 years, the total number of domestic branches for FDIC-insured institutions declined by almost 24% to fewer than 78,000 branches. This equates to an annual average decline of 2.1%. In 2Q21 and 2Q22, the y/y rate of decline exceeded 3%, but this slowed to 1.7% y/y to the end of June 2023.
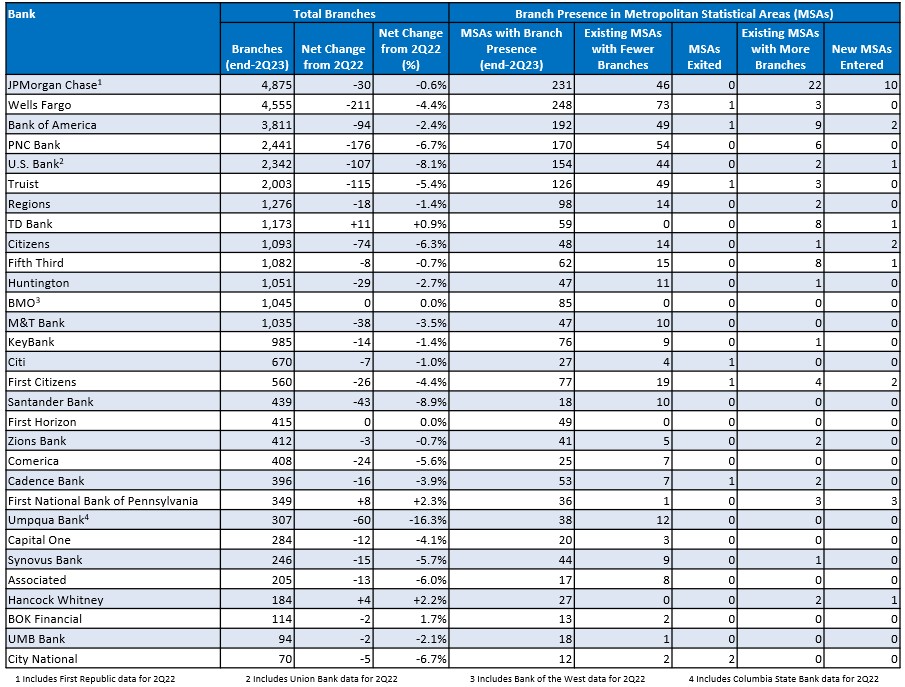
Some of the largest banks had the strongest percentage declines in branches. Our detailed analysis of 30 leading banks (see below) found a 3.1% y/y decline in branches (from 35,039 to 33,920) at the end of 2Q23. However four banks with networks of more than 2,000 branches reported declines of more than 4%: Wells Fargo (-4.4%); PNC (-6.7%); Truist (-5.4%) and U.S. Bank (-8.1%). Santander Bank reported the largest percentage decline (-8.9%).
Some banks are growing their branch networks. While the overall trend has been for banks to trim their networks, some banks are maintaining or even growing their commitment to this channel. TD Bank grew its network by 11 branches, adding branches in 8 existing markets, as well as opening its first branch in The Villages, FL. Following the collapse of its planned merger with First Horizon earlier this year, TD announced plans to open 150 U.S. branches by 2027 with a focus on Southeast markets.
Banks are maintaining their presence in the vast majority of their markets. While banks are reducing branch density in their existing markets, few are completely leaving these markets. Seven of the 30 banks exited a market over the past year, but only one left more than one market: City National Bank closed its branches in both Reno and Carson City, NV.
Branch closures were spread across many existing markets. Overall, the 30 banks closed branches in 22% of their existing markets, through several had higher percentages of existing markets impacted by closures, including Santander Bank (56%), Truist (39%) and PNC (32%).
Banks concentrated their reductions on markets with the largest branch networks. Banks reduced branch densities in many of their main markets, enabling them to cut costs while maintaining a significant presence. Although more than a third of Wells Fargo’s branch reductions took place in just 8 markets, each of those markets continues to have more than 100 branches.
Some banks are opening new branches in existing markets. The 30 banks increased branch numbers in 4% of existing markets, led by TD Bank (increased branch numbers in 14% of their existing markets) and Fifth Third (13%), who are both expanding their presence in key southeastern U.S. markets. JPMorgan Chase increased branch numbers in 22 markets (10% of its existing markets), including Washington (+11 branches), Minneapolis (+9), Kansas City (+7) and St. Louis (+7).
J.P. Morgan Chase is leading the way in market expansion. Over the past year, the bank opened branches in 10 new markets, including Buffalo and Virginia Beach (4 new branches in each market). This is part of a longer-term strategy to grow its branch footprint: the bank reported at its 2023 Investor Day that its population coverage rose from c. 60% in 2017 to c. 80% in 2022, with the bank now aiming for 85% population coverage.