7 Ways Banks Are Adapting Branch Networks to New Realities

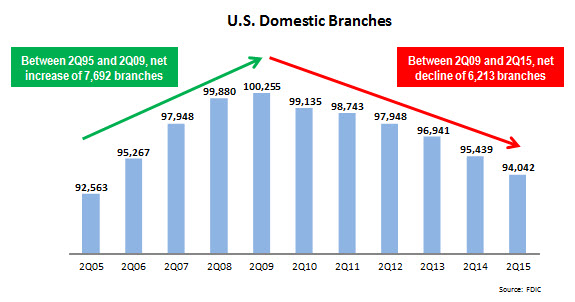
According to the FDIC, there were just over 94,000 domestic bank branches at the end of June 2015: a net reduction of almost 1,400 branches from end-June 2014, and a decline of more than 6,000 branches since the U.S. passed the 100,000 branch threshold in mid-2009.

domestic_branches_2Q05-2Q15

The recent decrease in the number of branches is being driven by a number of factors, including banks’ focus on cutting costs in recent years.  In addition, the emergence and strong growth of online and mobile banking usage has led to consumers significantly reducing their use of branches for transaction processing.  So how are banks adapting their branch networks to this changing channel environment?  An analysis of presentations by leading U.S. banks at the recent Barclays Global Financial Services Conference identified a number of ways that banks are restructuring, repositioning, redesigning and restaffing their branches to ensure that this channel survives and thrives into the future.

  • Continuing to pursue branch consolidation.  While banks continue to emphasize their commitment to the branch channel in general, they have cut their overall number of branches in recent years, and will continue to do so.  At the Barclays conference, KeyBank reported that it had cut its branch network by 10% in the past three years, and envisages a further ongoing reduction at a rate of 2-3% per year.
  • Selling off (and acquiring) branch networks.  Most leading banks believe they need to have critical mass in particular markets.  If they feel that they cannot achieve this goal, they may decide to exit the market entirely.  Citi is exiting a number of markets, as it seeks to focus on just 6 major metro markets.  Fifth Third recently announced that it is ending its branch presence in Pennsylvania.  These branch sell-offs create opportunities for other banks who want to grow their presence in those markets (BB&T acquired Citi’s branch network in Texas, and F.N.B is  buying Fifth Third’s 17 branches in Pittsburgh).
  • Developing a hub-and-spoke approach.  Rather than having a dense network of similarly-sized branches, some banks are looking to establish a hub-and-spoke approach in specific markets.  This approach typically features a flagship branch as well as a reduced number of small branches.  At the Barclays conference, Synovus claimed that it was applying a hub-and-spoke system.  Other banks with flagship branches include Bank of America and Citibank, which now has flagship branches in four of its six target U.S. metro markets.
  • Redesigning and re-staffing branches.  As the branch channel’s primary role shifts from transaction processing to sales and service, leading banks are overhauling store layouts and are replacing tellers with product experts.  In addition to closing or consolidating 400 branches in recent years, PNC reported that it has converted 300 branches to its universal banking model (featuring concierge stations and reformatted teller stations).  In addition to providing enhanced sales and services to branch visitors, PNC claims that these branches cost 45% less than traditional branches.  In terms of staffing, Bank of America reported that it has added nearly 1,200 financial solutions advisers and small business bankers over the past two years.
  • Growing in-store branch networks.  Banks like Huntington and U.S. Bank have significant in-store or on-campus branch networks, and remain committed to this channel.  Huntington Bank recently announced that it was adding 43 in-store branches in Michigan via its relationship with Meijer Stores.
  • Incorporating new functionality into online and mobile banking services to drive branch traffic. Bank of America reported that its clients used the bank’s online and mobile apps to schedule an average of 14,000 branch appointments per week in August 2015.  And in September 2015, Bank of America announced online and mobile banking enhancements, which included enabling clients to make same-day financial center appointments.
  • Applying guerrilla marketing tactics.  Banks are becoming more creative in how they establish a physical presence to better interact with clients and prospects.  Leveraging its relationship with the Green Bay Packers, Associated Bank has set up a virtual branch in the parking lot of Lambeau Field to target tailgaters.

While the overall number of branches is likely to continue to decline, most banks appreciate the key role that branches play in sales, service and branding, and remain committed to the channel.  However, banks will continue to adjust branch density, design, layout, staffing and integration with other channels, in order to control costs and adapt to new consumer preferences and behaviors in how they interact with their banks.
Leading U.S. Banks Maintain Commercial Lending Momentum

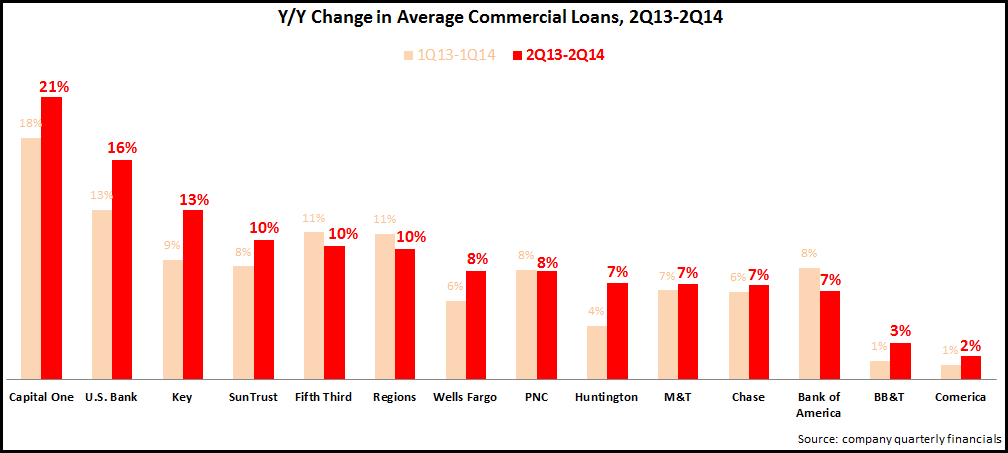
Strong growth in commercial lending for leading U.S. banks has offset declines in other loan categories in recent years, but coming into 2014, there was evidence that the rate of growth in commercial lending was tailing off.  However, EMI’s analysis of second quarter 2014 financials for 14 leading banks shows that commercial loan growth remains robust.  Average commercial loans rose 8.4% between 2Q13 and 2Q14, up from a 7.4% y/y growth rate in 1Q14.

av_commercial_loans_2Q14

10 of the 14 banks reported stronger y/y growth in 2Q14 compared to 1Q14.  Most banks attributed the stronger growth to improved business confidence.  Other factors that drove commercial loan growth included:

  • Slow but steady growth in commercial loan utilization: for most banks, loan utilization is well below historic norms, but there has been a gradual improvement in this metric in recent quarters.  Fifth Third reported that its commercial loan utilization rate rose from 30% in 1Q14 to 32% in 2Q14.  Chase’s loan utilization grew three percentage points in the first half of 2014 to 33%, but this remains well below the 40% level that Chase considers to be the historic norm.
  • Industry targeting propelling overall commercial loan growth.  A number of leading banks attributed a significant part of their growth to their targeting of specific industry segments.  Huntington Bank reported that half of its commercial loan growth came from targeted verticals.  Comerica reported strong y/y growth in its technology and life sciences (+32%), as well as its energy (+10%) portfolios.

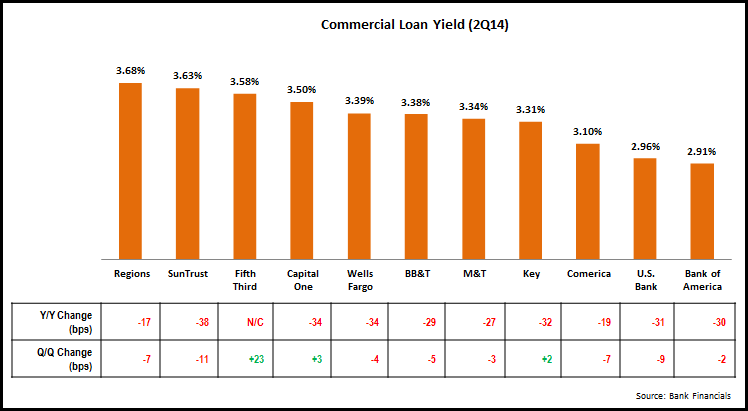
As banks have been pushing to grow their commercial loan portfolios in recent years, yields have been steadily decreasing.  So, with banks continuing to report strong commercial loan growth in 2Q14, did loan yields continue to decline?  The answer: yields continued to decline on a y/y basis for most banks, as the market remains very competitive.  For the 11 leading banks in the chart below, 10 reported double-digit basis-point declines in commercial loan yields between 2Q13 and 2Q14.  And two of the banks—U.S. Bank and Bank of America—now have yields below 3%.  However, there are some signs that the decline in yields is beginning to taper off; three of the banks—Fifth Third, Capital One and Key—reported q/q increases in their commercial loan yields.

commercial_loan_yield_2Q14

Assuming that economic growth and business confidence continue to grow, demand for commercial loans should also continue to remain robust.  The following are four areas where banks should concentrate efforts in order to propel their commercial loan growth:

  • Identify and target high-potential commercial segments.  Banks need to look at both external and internal factors in identifying high-potential segments.  The external factors include segment size and growth rates, as well as segment clusters within the bank’s commercial banking footprint.   Internal factors include having the required in-house skills, experience and product solutions to effectively target these segments.  Industry sector represents the most effective segmentation criterion, given the fact that companies within industries tend to have similar characteristics and needs.  However, banks should also look to identify opportunities using other business segmentation criteria, such as ethnicity and gender.
  • Develop consistent marketing for all commercial banking solutions.  Due to their silo-ized structures and cultures, different groups within a commercial banking organization may develop their own marketing and sales communications, which can create confusion for clients.  Banks should create an overall value proposition for their commercial banking operations, as well as guidelines for messaging and creative executions, to provide a unified face to the client.
  • Capture cross-sell opportunities.  Again due to their traditional structures and cultures, banks have often fallen short in developing synergies across business units and selling the entire bank to the customer.  However, banks like Wells Fargo and Huntington have been steadily growing commercial cross-sell rates.   Banks should build programs to grow referrals rates between different business units, and should incorporate both retention and cross-sell goals into commercial bankers’ compensation structures.
  • Invest in Content marketing.  In a world where we are overwhelmed with information, commercial clients will be attracted to a bank that can provide insights and advice on various topics.  In developing content for commercial clients, the topics need to be of interest and importance to the client.  They also need to be topics on which the bank can speak authoritatively.  And lastly, banks need to take into account that the objective of content marketing is not to promote its products and solutions, but rather to position itself as a valuable source of intelligence and advice.

Four Takeaways from Credit Card Issuer 1Q14 Financials

The following are four key takeaways from the 1Q14 financials for 13 U.S. banks with significant credit card operations.

  1. Some improvement in outstandings performance
  2. Continued volume growth
  3. Charge-off rates at or below historic norms
  4. Little change in industry profitability

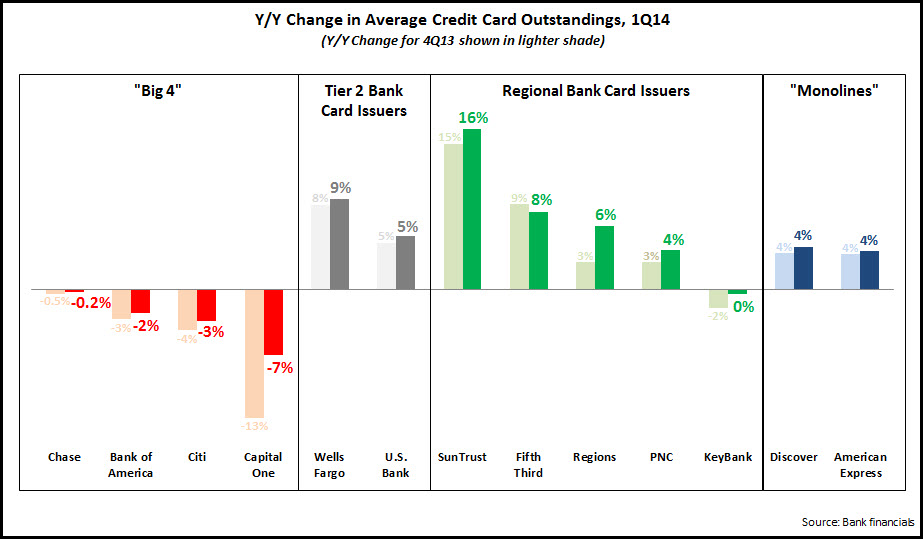
Average outstandings for the 13 issuers in 1Q14 were unchanged y/y, an improvement from a 2% y/y decline in 4Q13.

  • For the four largest issuers—Chase, Bank of America, Citi and Capital One—the rate of decline in average outstandings improved from 5% in 4Q13 to 3% in 1Q14.  Capital One highlighted progress made in working through run-off portions of the acquired HSBC portfolio, and it expects outstandings growth in the second half of 2014.  Other issuers are ramping up new account production: Bank of America originated more than 1 million new accounts for the third consecutive quarter, while Chase opened 2.1 million new accounts in 1Q14, 24% higher than 1Q13.
  • For Tier 2 bank card issuers—Wells Fargo and U.S. Bank—the rate of outstandings growth rose from 7% in 4Q13 to 8% in 1Q14.  Wells Fargo benefitted from the continued growth in credit card penetration of its retail banking households, which rose from 34% in 1Q13 to 38% in 1Q14.
  • Similarly, regional bank card issuers grew average loans 6% in 1Q14, compared to 5% in 4Q13.
  • Credit card loan growth rates for the former ‘monolines’—American Express and Discover—were unchanged at 4%.

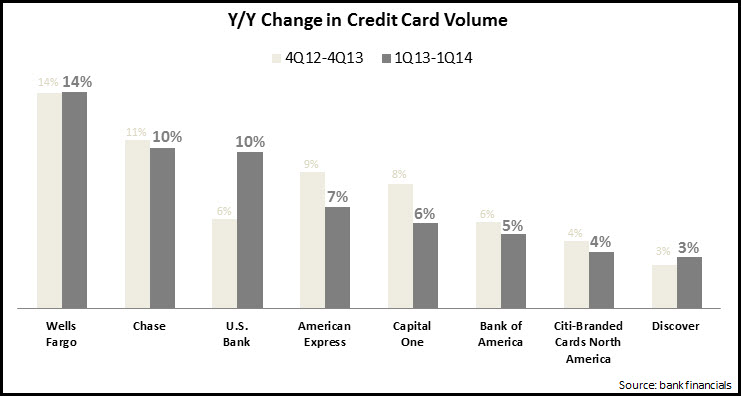
Eight leading issuers reported 7% y/y growth in credit card volume in 1Q14, slightly lower than the 4Q13 increase.  Three issuers—Wells Fargo, Chase and U.S. Bank—reported double-digit percentage growth in 1Q14.  In general, issuers appear committed to continuing to push volume growth, as evidenced by the launch of new rewards cards with strong earnings potential (e.g., American Express Everyday), as well as enhancements to existing rewards programs.

12 of the 13 issuers reported y/y declines in net charge-off rates in 1Q14.

  • 12 issuers now have charge-off rates below 4%.  The only major issuer with a charge-off rate above 4% is Capital One, who reported that the acquired HSBC card portfolio added about 25 basis points to its charge-off rate in 1Q14. It expects that the impact of this portfolio would be mostly gone by the end of the second quarter.
  • 10 reported charge-off rate increases between 4Q13 and 1Q14. This were attributed to seasonality, as well as indications that rates are starting to move back towards normalized levels as issuers seek to build outstandings growth.
  • However, it is worth noting that delinquency rates—which have traditionally been a leading indicator of future directions in charge-off rates—continue to decline on both a y/y and q/q basis for most issuers.

The six issuers who provide card-related revenue and cost information, reported that card profitability was virtually unchanged between 1Q13 and 1Q14.  Revenue growth remains elusive, declining 1%, as net interest income fell 2%.  The relatively strong rise in card volume did not translate into similar growth in noninterest income, as issuers are enhancing their rewards programs, which eats into interchange income (e.g., Discover reported that its rewards rate 11 bps y/y to 1.03% in 1Q14).  Noninterest expenses (reported by five issuers) were unchanged y/y, while provisions for loan losses rose 6%, as issuers anticipate future charge-off increases.