FDIC bank data shows continued C&I–and even some small business–loan growth

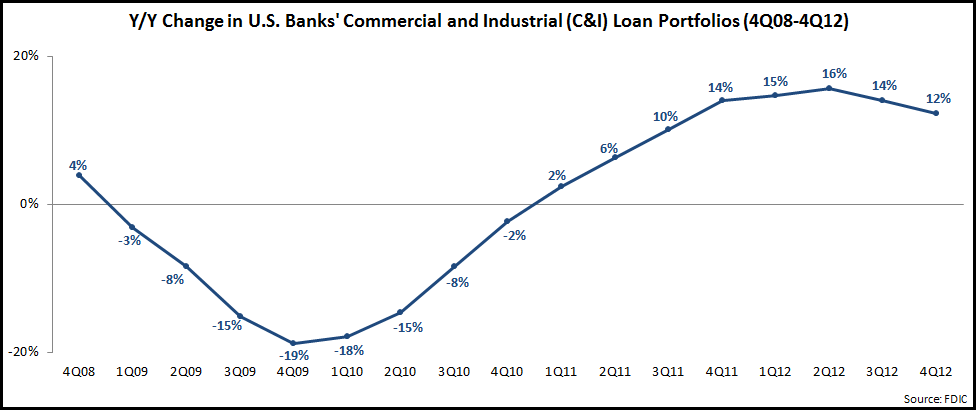
This week, the FDIC published end-4Q12 data for all U.S. banks showing that U.S. banks’ commercial and industrial (C&I) loan portfolios rose 12% in the year to end-4Q12.  This marks the sixth consecutive quarter with double-digit y/y growth, although the rate of increase has fallen from a high of 16% in 2Q12.
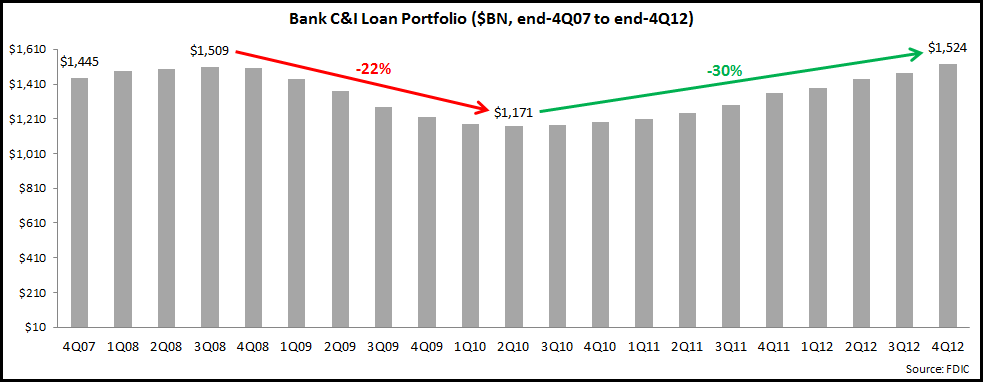
Banks are increasingly looking to commercial lending as a way to grow their overall business, but they are concerned that the current growth rate can be sustained, in particular given the precarious nature of the U.S. economic recovery.  The following chart shows that the strong growth rates over the past two years has resulted in C&I loan portfolios returning to levels seen just prior to the financial crisis.
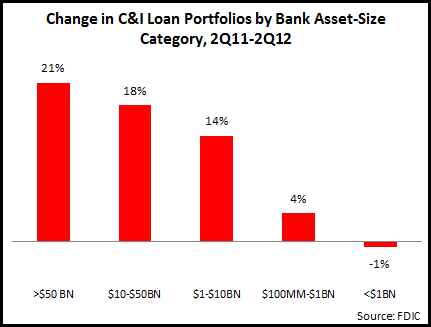
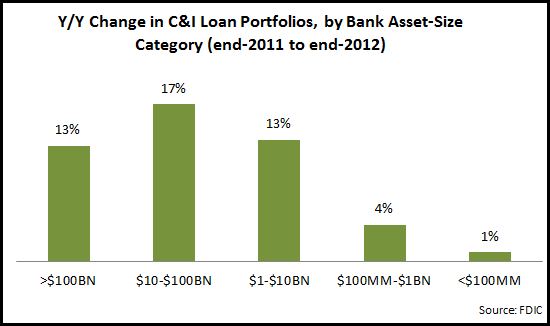
The data also shows a market difference in C&I loan portfolio growth performance by different bank-asset classes, with larger banks significantly outperforming those with less than $1 billion in assets.

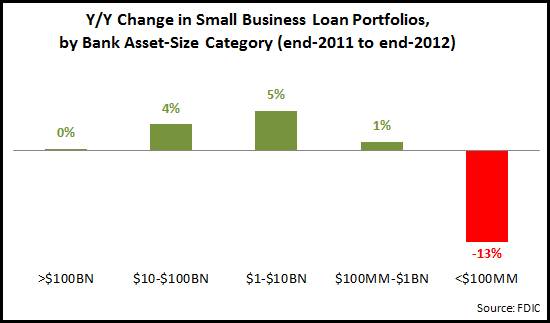
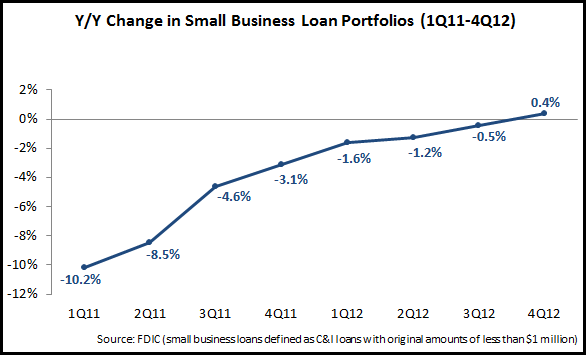
Although banks’ C&I loan portfolios have recovered strongly in recent years following the financial crisis, small business loan portfolio growth remains elusive.  The FDIC started to report small business loan data in 1Q10, and since then small business loan portfolios have decreased by 10%.  However, there are signs that this period of decline has finally bottomed out, with a y/y increase of 0.4% at the end of 2012.

As with their overall C&I loan portfolios, larger banks–led by banks with $1-$10 billion in assets–reported strongest small business loan portfolio growth, while community banks with less than $100 million in assets saw a 13% y/y decline in their small business loan portfolios.
U.S. banks are reducing, repositioning branches

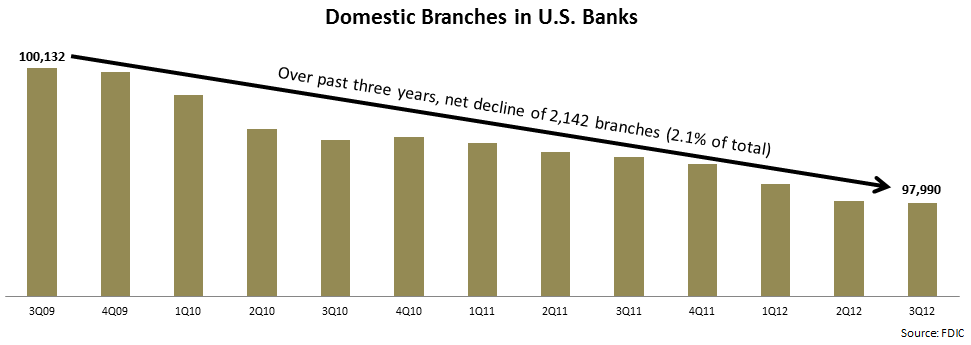
An EMI analysis of recently-published quarterly bank data by the FDIC found that U.S. banks are continuing to reduce branch numbers.

U.S. branches are very heavily concentrated in a limited number of banks:

  • Just 50 banks (<1% of all banks) hold more than than half of all branches (51%).
  • More than 6,100 banks (93% of all banks) have five or fewer branches.  And, of these, more than 1,400 branches have just one branch.

Bank branch numbers change based on bank merger-and-acquisition activity, purchase and sale of portions of branch networks, as well as organic growth.

  • Over the past year, the vast majority of banks (83%) did not change branch numbers.
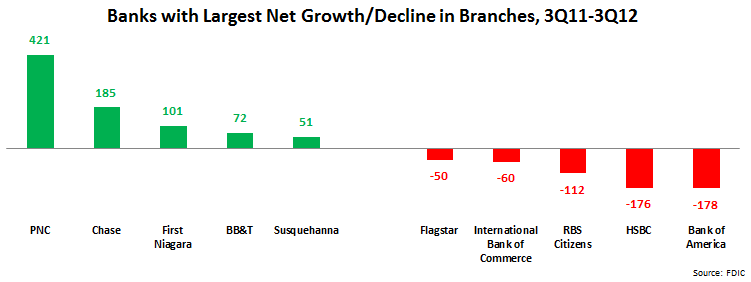
  • 548 banks (8% of all banks) grew their networks by a total of 2,359 branches.  PNC had the largest growth (+421 branches), largely due to its acquisition of RBS Bank as well as an Atlanta branch network from Flagstar Bank.  Chase also had strong growth (+185 branches), driven by organic growth in key expansion markets like California and Florida.
  • 609 banks (9% of the total) reduced their branch networks by a total of 3,092 branches.  Aside from bank sales/closures, the bank with the largest decline was Bank of America, which is in the process of cutting its branch numbers by 10-15%.

Even following the reduction in branch numbers, there are almost 98,000 bank branches in the U.S., so clearly the branch channel is not going away anytime soon.  However, more and more customers are gravitating to self-service electronic channels for their everyday banking needs, so a reassessment of branches’ traditional role is needed.  At the same time, branches have untapped potential as sales, advice and marketing channels.  The following are some key areas that banks need to focus on to both right-size their branch networks and equip these branches to realize their full sales, service and marketing potential:

  • Network density.  Banks will need to determine optimal branch density in key markets, in order to maintain a significant physical presence, and deter competitive market entry, while avoiding significant overlap between branch catchment areas.
  • Branch size. Less traffic in branches will necessitate smaller branches in some markets.  Some banks are already creating a variety of branch formats to reflect different market opportunities (as defined by market profiling that covers information like the number/projected growth of people and businesses within a radius of the branch, the bank’s overall strength in the market, as well as competitive intensity).
  • Branch design.  The design and layout should reflect branches’ new sales and advisory role, with less space for teller counters, and a layout more conducive to staff-customer face-to-face interaction.  Recognizing that branches play an important branding and PR role for the banks, many banks are redesigning branches to convey a more customer-friendly image and promote connections with the local community.
  • Staffing. Again, the changing role of the branch will mean that there will a reduced need for tellers with a greater role for specialists, such as mortgage bankers, investment advisors and small business bankers.  Staff training and support tools will need to reflect their new roles in the branch.
  • Technology and channel integration. As banks change the design and staffing of branches, they are incorporating technology to showcase new products and services, connect with remote staff (e.g., using videoconferencing in the branch to connect to financial advisors), and promote other bank channels (Bank of America is using QR codes in teller counters to enable customers to download its mobile banking app.)

FDI data confirms robust C&I loan growth among U.S. banks

Most of the leading U.S. banks highlighted continued robust C&I loan growth in their most recent financials.  Recently-published data from FDIC provides C&I loan data for all of the 7,200 U.S. banks, enabling us to develop a more comprehensive picture of overall changes in C&I lending, as well as making comparison between different bank-size categories.

The following are some topline takeaways from an EMI Strategic Marketing, Inc. analysis of the FDIC C&I loan data:

  • C&I loan portfolios for all FDIC-insured banks rose 18% year-over-year, to more than $1.4 trillion at the end of 2Q12
  • Looking at different C&I loan-size categories, the portfolio of loans of more than $1 million jumped 23% y/y.  However, the portfolio of loans of less than $1 million grew by only 2%.
    • Within the C&I loans of <1MM category, strongest growth was for <$100K loans (mainly business credit card loans), which rose 5% y/y
  • Continuing a trend seen in recent quarters, the larger banks (>$50  billion in assets) had the strongest y/y rise in overall C&I loans.

  • Reflecting the trend in overall C&I loans, the largest banks had the strongest growth in small business loans (of <$100K).