Continued improvement in credit quality metrics for leading bank card issuers

All of the leading bank card issuers reported continued improvement in key credit quality metrics for their credit card portfolios in 1Q11, as seen in the following charts.

As a result of these improvement, banks have slashed their provision for credit losses, which has significant boosted profitability.

However, banks’ credit card outstandings are continuing to decline.  In reporting financials, a number of banks reported that they expect outstandings to grow in the second half of the year, and in arecent months, we have seen signs of more aggressive acquisition activity (such as growing direct mail volume and re-appearance of lengthly 0% balance transfer offers).  However, banks will certainly be very cautious in their efforts to grow lending in the coming quarters, as they seek to avoid any repitition of the over-exhuberant lending climate taht prevailed in the middle of the last decade.
FDI data confirms robust C&I loan growth among U.S. banks

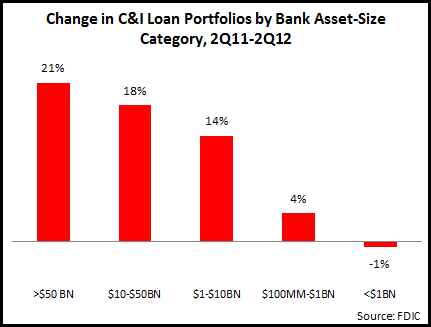
Most of the leading U.S. banks highlighted continued robust C&I loan growth in their most recent financials.  Recently-published data from FDIC provides C&I loan data for all of the 7,200 U.S. banks, enabling us to develop a more comprehensive picture of overall changes in C&I lending, as well as making comparison between different bank-size categories.

The following are some topline takeaways from an EMI Strategic Marketing, Inc. analysis of the FDIC C&I loan data:

  • C&I loan portfolios for all FDIC-insured banks rose 18% year-over-year, to more than $1.4 trillion at the end of 2Q12
  • Looking at different C&I loan-size categories, the portfolio of loans of more than $1 million jumped 23% y/y.  However, the portfolio of loans of less than $1 million grew by only 2%.
    • Within the C&I loans of <1MM category, strongest growth was for <$100K loans (mainly business credit card loans), which rose 5% y/y
  • Continuing a trend seen in recent quarters, the larger banks (>$50  billion in assets) had the strongest y/y rise in overall C&I loans.

  • Reflecting the trend in overall C&I loans, the largest banks had the strongest growth in small business loans (of <$100K).

Market-Specific Metrics Inform Bank Branch Network Investments

The emergence of virtual channels, the need to cut costs and speculation of more industry consolidation are all spurring banks to reconsider their branch networks.  Recently, EMI Strategic Marketing Inc. published blogs on the changing role of the branch, as well as trends in branch numbers for leading U.S. banks.

Banks have reiterated their commitment to the branch channel, but many are unlikely to maintain branch numbers at current levels.  Bank decisions of branch numbers and deployments are increasingly based on an analysis to the bank’s relative strengths in different markets.  Is the bank’s branch network spread too thinly, with few branches and low deposit shares in many markets?  Does it have critical mass in terms of branch numbers and/or deposit share in particular market? If it does not have sufficient scale at present, should it expand its branch network organically or through acquisition? Or should it leave some markets?

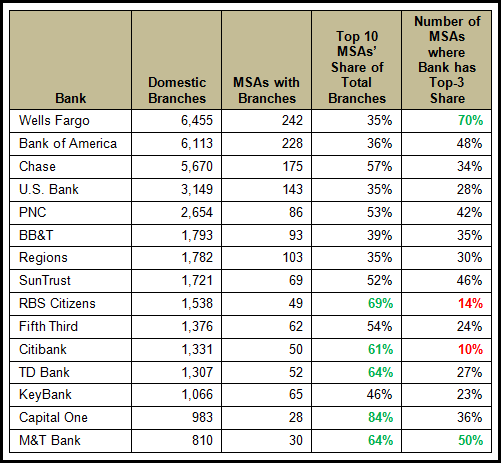
EMI Strategic Marketing Inc. analyzed end-2Q11 FDIC data on the branch footprint of the top 15 retail banks. (Note: this does not include M&A activity over the past year, such as PNC’s acquisition of RBC Bank.)  We focused on the number of metropolitan statistical areas (MSAs) where these banks had branches, branch concentration levels, and market strength indicators.

  • The banks with the most extensive branch networks are Bank of America and Wells Fargo, who both have branches in more than 200 MSA markets.
  • Regional banks naturally have a more concentrated branch presence.  RBS Citizens, PNC and M&T all have more than 60% of their branches in 10 markets.
    • RBS Citizens has top-three share in only 14% of the 49 markets where it has a physical presence.  Recent speculation indicates it may sell off its branch network in Illinois and Michigan.  The bank has branches in seven MSAs in these two states, but does not have a top-three deposit share in any of these markets.
  • Market strength: Wells Fargo has a top-three deposit share in 70% of its MSAs.   Four other banks (M&T, Bank of America, SunTrust and PNC) are ranked in the top three in more than 40% of their markets.
  • In late 2010, Citigroup announced that it would be concentrating on 16 U.S. metro markets.  This helps to explain why 61% of Citibank’s branches are in just 10 MSAs.  On the other hand, it has five or fewer branches in more than half of its markets.  Given its stated objective to concentrate its efforts on about 15 metro markets, we can expect Citibank to leave many of these markets where it has a token presence.  However, it will be aiming to significantly grow share in its target markets.
  • Capital One, which has built a retail branch presence in recent years through acquisition, has 84% of its branches in just 10 MSAs. (In fact, 57% of Capital One branches are in just two MSAs: Washington-Arlington-Alexandria, DC-VA-MD-WV and New York-Northern New Jersey-Long Island, NY-NJ-PA.)