Credit Card Issuers Increase Focus on the Subprime Market

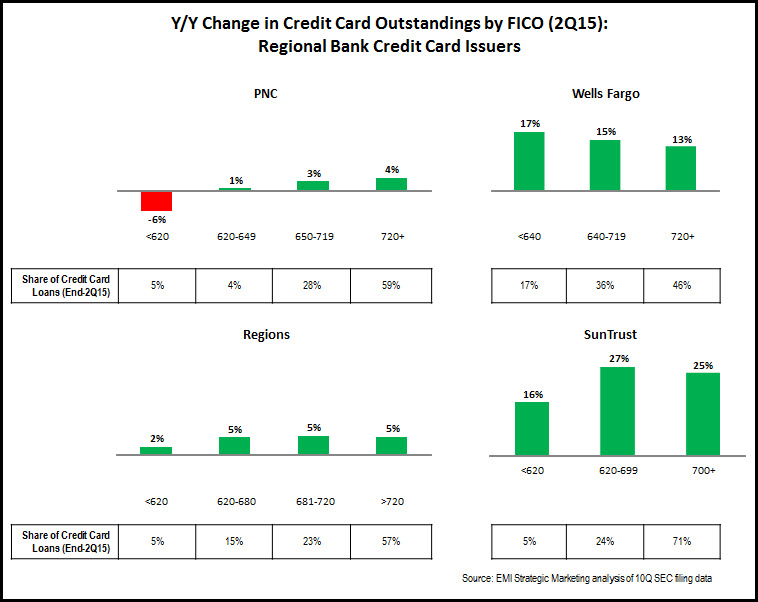
The American Banker Association’s September 2015 Credit Card Market Monitor found a 28% y/y rise in new subprime accounts, indicating that issuers are expanding their focus as they seek to grow revenues. An analysis by EMI Strategic Marketing of the FICO composition of credit card outstandings at the end of 2Q15 finds that many leading card issuers are accelerating growth in sub-prime and low-prime outstandings.

  • In recent years, Wells Fargo has reported strong y/y growth in all FICO categories.
    • In its <600 FICO category, growth has accelerated to double-digit rates in the past three quarters.
    • Its 600-639 FICO category has grown by double-digit rates in six of the past seven quarters.

wells_fargo_subprime_outstandings

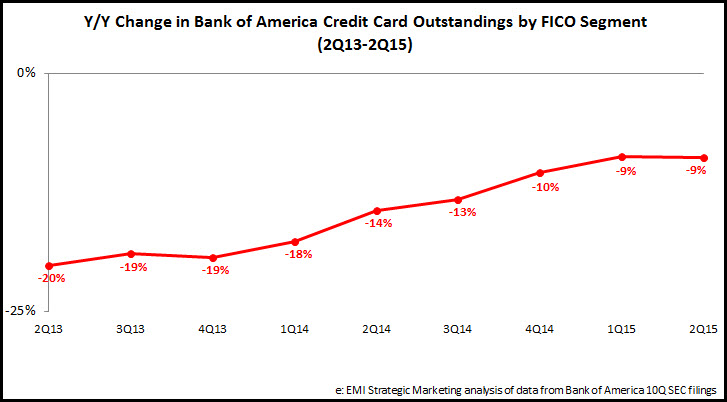
  • Among national credit card issuers, Bank of America’s subprime outstandings declined 9% y/y in 2Q15, but the rate of subprime loan decline has been steadily slowing in recent quarters.  However, Citi’s subprime outstandings growth performance is less consistent, with y/y growth from 4Q13 to 2Q14 followed by declines for the past four quarters.
BofA_subprime_outstandings

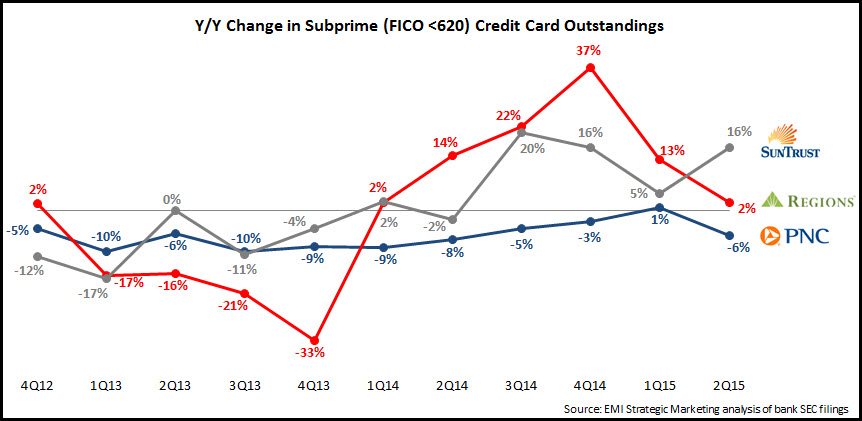
  • There are also mixed trends when analyzing subprime outstandings performance of regional bank card issuersPNC reported a 6% y/y decline in <620 FICO outstandings in 2Q15, compared to a rise of 1% in 1Q15.  Regions reported strong growth in <620 FICO in recent quarters (double-digit y/y rises between 2Q14 and 1Q15), but this fell to just 2% in 2Q15.  However, it should be noted that Regions’ total subprime outstandings were just $49 million, so variations in growth rates are not unexpected.  SunTrust reported double-digit y/y increases in subprime outstandings for three of the past four quarters.

regional_bank_card_subprime_outstandings

EMI’s analysis also shows that subprime outstandings growth continues to trail prime and superprime outstandings growth for several reasons:

  • The large national issuers continue to deal with legacy issues following the financial crisis.
  • For issuers in general, underwriting standards continue to favor superprime consumers.
  • And even though many issuers are ramping up subprime account production, it will take some time before it translates into strong growth in subprime outstandings.

BofA_citi_credit_score_2Q15

regional_bank_card_issuer_credit_score_2Q15

Meanwhile, an analysis of FDIC data for the 2Q15 shows strong outstandings growth for subprime credit card specialists, including Comenity (+23% y/y) and Merrick Bank (+16%). As the card industry in general increase its focus on the subprime market, it will be interesting to see if the acceleration in subprime outstandings growth among some regional bank card issuers is replicated by the large national issuers.  In addition, growth in subprime credit card outstandings should result in delinquency and charge-off rates rising from their current historically low levels.

10 takeaways from leading credit card issuer 2Q15 financials

The major U.S. credit card issuers have now published their quarterly financials.  A review of these reports by EMI revealed the following 10 trends:

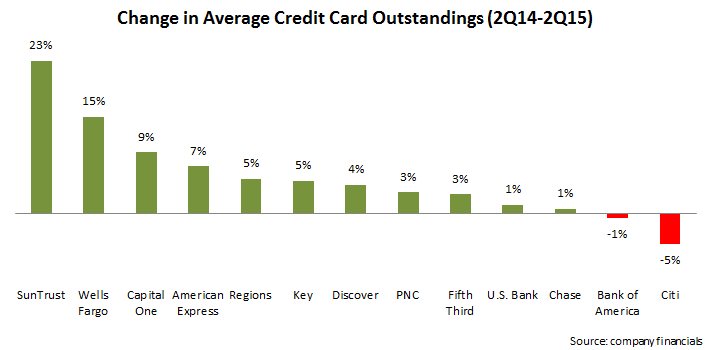
  1. Outstandings are growing. Credit card loan growth is once again being led by regional bank card issuers (such as SunTrust and Wells Fargo who tend to cross-sell cards to existing bank customers), as well as card “monolines” (such as Capital One and American Express). Banks with national credit card operations report lower growth (or even declines) as a result of the lingering effects from the financial crisis, runoff of promotional rate balances, as well as high payment rates. But even here we are seeing signs of growth: although Bank of America reported a 1% y/y decline in average outstandings, it also reported its largest quarter for new account origination since the fourth quarter of 2008.
    card_outstandings_2Q14-2Q15
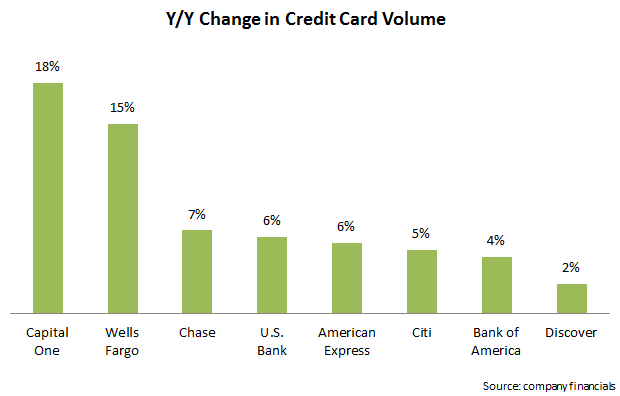
  2. Volume continues to grow, but with some slowdown. Some leading issuers continue to grow volume at double-digit rates (Wells Fargo grew loans and volume by 15%, boosted in part by the bank’s acquisition of the Dillard’s portfolio). Other issuers had lower volume growth, and many pointed to the impact of lower gas prices. For example, Discover reported volume growth of just 2%, but absent gas prices, this growth was 5%.card_volume_2Q14-2Q15
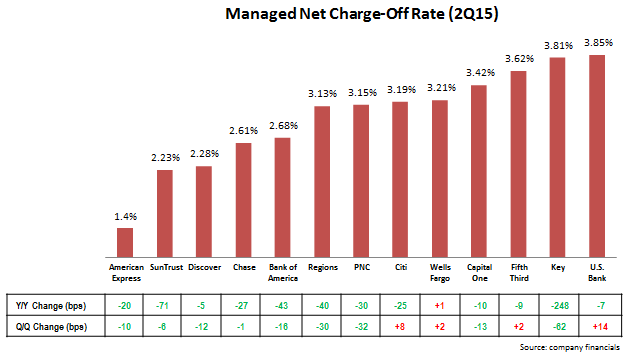
  3. Net charge-off rates continue to decline to historic lows. For many leading issuers, net charge-off rates are well below historic norms. In addition, the rates continue to decline; of the 13 issuers studied, 12 reported year-on-year charge-off rate declines.
    card_charge-off_rate_2Q15
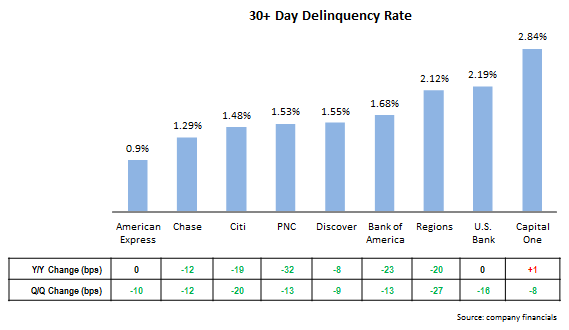
  4. 30+ day delinquency rates are also declining. Delinquency rates tend to be a leading indicator of future charge-offs, so it is notable that 30+ day delinquency rates continue to decline.
    delinquency_rate_2Q14-2Q15
  5. The profit picture is mixed for issuers. Six leading issuers provide credit card profitability data, as they operate standalone payment units. Four of the six issuers reported y/y declines in profitability as growing expenses exceeded revenues. However, Chase increased net income  for its Card Services unit by 33%, driven by lower costs (9% decline in noninterest expense, and 10% fall in provision for loan losses). American Express grew its U.S. Cards net income by 15%, as revenue growth of 6% and a 4% decline in provisions exceeded a 4% increase in noninterest expense.
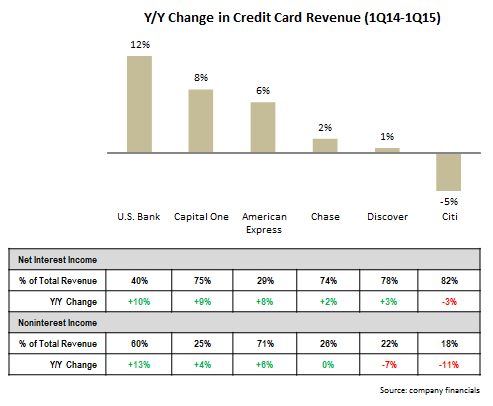
  6. Growth in lending and volume are driving revenue growth. In the wake of the 2008 Financial Crisis and subsequent industry retrenchment, credit card industry revenues fell significantly. As the economy stabilized and then grew, leading issuers continued to struggle to attain revenue growth. Now the return to outstandings growth, as well as continued loan growth, is finally enabling issuers to increase revenues.
    revenues_2Q15
  7. To support this revenue growth, card issuers’ noninterest expenses are increasing. The rise in revenues is driving growth in expense areas like marketing and rewards costs. Of the five issuers providing noninterest expense data, four reported y/y increases, led by Discover (+18%) and U.S. Bank (+13%).
  8. Provisions for loan losses are (mainly) decreasing. As net charge-off and delinquency rates continue to decline, three issuers reported y/y declines in their provisions for loan losses. However, Capital One and U.S. Bank increased provisions, with Capital One growing provisions by 69%.
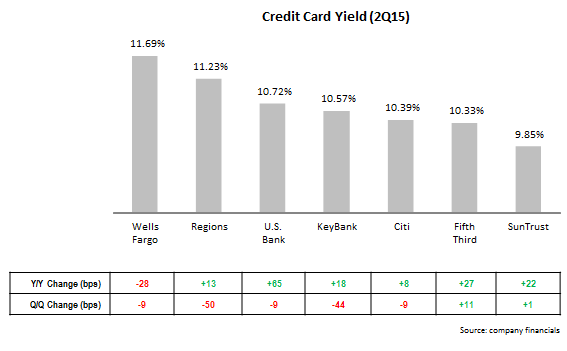
  9. Issuers are increasing credit card yield. Of the seven leading issuers who reported card yield in their financials, six reported y/y growth. The exception was Wells Fargo, which had the highest yield in 2Q15. However, five of the seven reported q/q declines; the exceptions were Fifth Third and SunTrust, which had the lowest yield among reporting issuers.
    card_yield_2Q15
  10. Issuers are using a range of channels for new account acquisition. In general, cards issuers are continuing to reduce their dependence on direct mail for new card acquisition, and are focusing more investment on digital and branch channels. Chase reported that its online channel accounted for 62% of new card accounts in 2Q15. Even though Citi is continuing to cut its U.S. branch network, it reported that credit card acquisition via branches was up 10% on a same-store basis.

5 channel takeaways from 1Q15 U.S. bank financials

The quarterly reports of the leading U.S. banks revealed a number of important channel trends:

  1. Mobile banking is continuing its strong growth.  Three of the leading U.S. banks provided quarterly updates on active mobile banking users, and each reported double-digit y/y growth in 1Q15: Chase +22% to 20.0 million; Bank of America +13% to 16.9 million; and Wells Fargo +19% to 14.9 million.  According to eMarketer, more than half of adult mobile phone users are expected to use mobile banking in 2015.
  2. Consumers are transitioning to self-service channels for a growing range of transactions.  PNC reported that 50% of its consumer customers used non-branch channels for a majority of their banking transactions in the first quarter of 2015, up 7 percentage points y/y.  PNC also reported that the non-branch (ATM and mobile) channel share of deposit transactions doubled from 20% in 1Q13 to 40% in 1Q15.
  3. Many banks are slowly shrinking their branch networks.  Leading banks who reported significant branch reductions in the most recent quarter include: Citibank (down 61 during the quarter, as its pursued its strategy of consolidating its presence in 7 U.S. markets), PNC (-37 branches), Regions (-33) and Chase (-31 ).  Although Bank of America has closed more than 800 branches over the past three years, the net branch decline fell to 20 in the first quarter of 2015.
  4. Some banks are growing branch numbers…and in-branch sales staff.  In spite of the general perception that the branch channel is in the process of terminal decline, some banks are in fact acquiring or opening branches in order to capture growth opportunities.  Huntington Bank reported the addition of 43 new in-store branches in Michigan.  And even though Bank of America reduced branch numbers by 260 over the past year, it grew sales specialists by 5%.
  5. Banks remain committed to the branch network as consumers use multiple banking channels.  While electronic self-service channels have a dominant share of everyday banking transactions, branches still play a key role in areas like new account generation, customer relationship management (including cross-sell), and branding.  Wells Fargo claims that its most loyal customers are not those who have the most products, but rather those who use the most channels most often.  It reported that mobile banking sessions rose 38% in 2014, while branch visits remained steady.