Tentative Recovery in U.S. Credit Card Lending Continues in 1Q13

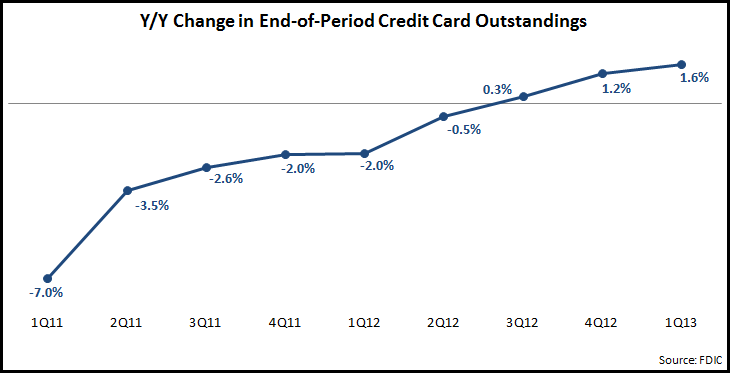
EMI’s analysis of recently-published U.S. bank data by the FDIC reveals that credit card outstandings rose 1.6% y/y to the end of 1Q13.  Outstandings have been recovering in recent quarters, following a protracted period of declines as a result of the 2008 financial crisis.  In addition, net credit card charge-offs continue to decline, falling 12% y/y in 1Q13.

Our analysis also finds that:

  • 1,238 U.S. banks (19% of the total) have card assets, with 6% of banks having more than $1 million in card assets.  55 banks have more than $100 million in outstandings, with just 23 banks holding more than $1 billion in credit card loans.
    • Of the 55% with more than $100 million in assets, 31(56%) reported increases in their credit card loan portfolios between end-1Q12 and end-1Q13
  • The three largest credit card issuers–Citibank, Chase and Bank of America–all continued to report credit card loan declines, as they continue to deleverage.  The cumulative decline for these three issuers was 5%.
  • The former “monolines”–American Express, Discover and Capital One–all increased outstandings.  Capital One reported a 44% increase, largely due to the acquisition of the HSBC card portfolio.  American Express grew credit card loans 6%, with Discover’s outstandings rising by 7%.
  • Many regional banks continued to increase credit card lending, albeit from significantly lower bases than their national bank counterparts.

These trends in credit card outstandings–slow overall growth, declines among the big three issuers, growth for monolines and regional banks–are consistent with industry predictions that EMI published in a blog earlier this year.
What will happen in the U.S. credit card industry in 2013: 10 potential trends

As it enters 2013, the credit card sector is looking to continue its slow-but-steady recovery following the financial crisis in 2008-09. The following are a series of industry trends that we expect to see over the next 12 months:

  1. Outstandings growth, but not for top three issuers. Economic recovery and returning consumer confidence should result in consumers increasing their demand for credit. However, the lingering scars from the financial crisis for both banks and consumers will temper this demand.  The top three credit card issuers (Chase, Bank of America and Citi) have scaled back their portfolios dramatically in recent years. These issuers claim that this period of retrenchment is coming to an end, but they are highly unlikely to grow their portfolios significantly in 2013.  Instead, outstandings growth will come from issuers like:
    • Discover: recently reported 6% y/y growth in outstandings and plans to continue to push lending growth
    • Wells Fargo: grew average outstandings 9% y/y in 4Q12, as it continues to grow credit card penetration of its retail banking households (from 27% in 1Q11 to 33% in 4Q12)
    • Other regional banks, such as SunTrust, Fifth Third and PNC: who all reported strong y/y outstandings growth in 3Q12 (albeit from relatively low bases), and who (like Wells Fargo) are focused on cross-selling credit cards to existing customers
  2. Push for loan growth to lead to (some) price competition. In recent years, credit card APRs have been relatively high. Even as competition returned to the affluent card market in 2011 and 2012, there was little or no evidence of APRs moving downwards, with issuers competing instead with bonus points and tiered rewards programs. 2013 may bring some downward pressure on APRs, but issuers will continue to focus on both bonus offers and low introductory rates on purchases and/or balance transfers.
  3. Lower rate of volume growth. Over the past two years, in the absence of loan growth, issuers have been focusing on growing volume, but there are recent signs that the rate of growth is slowing down. American Express recently announced 8% volume growth in 4Q12, down from 11% in 4Q11 and 15% in 4Q10. Issuers will continue to target volume growth in 2013, but will be looking for volume and loan growth to be more in synch than in recent years.
  4. Return of revenue growth. With the expected return to some outstandings growth, net interest income should grow significantly in 2013, in particular with interest expense remaining low. Noninterest income will benefit from continued volume growth, but this will be partially offset by many issuers pulling back on marketing payment protection products, which featured prominently in a number of issuer settlements in the past year.
  5. Charge-offs and delinquency rates to return to a more “normalized” pattern. For many leading issuers, charge-off rates are below historic levels. As issuers begin to target outstandings growth, they will be willing to accept small increases in the charge-off rate. Some issuers are reporting q/q growth in delinquency rates, indicating a return to seasonal patterns that have been largely absent in recent years.
  6. Pressure to reduce rewards program costs. Issuers’ desire to grow purchase volume among more affluent cardholders in recent years has led to a significant focus on their rewards programs, with the development of tiered rewards, as well as aggressively positioned bonus offers. There are a number of factors that may lead issuers to scale back these rewards-based offers in 2013, including:
    • The continuing need to control costs;
    • The desire for a more even balance between outstandings and volume growth; and
    • The opportunity to develop more merchant-funded offers, in particular as merchants seek to capture consumer spend as it moves to online channels.
  7. Growth of personalized offers. Advances in data analytics create opportunities for issuers to develop targeted offers based on cardholder demographics, preferences and spending behavior. In addition, the emergence of mobile payments creates the potential to incorporate customer location into offer targeting.
  8. Emergence of mobile payments. Both mobile wallets and mobile payments have garnered a lot of attention over the past year, although there is a long way to go before they properly emerge as accepted payment methods. However, in 2013, there will be a number of critical steps taken in the continued evolution of mobile payments, including:
    • Launch of more mobile devices with more payment capabilities
    • Continued growth of mobile person-to-person payments and mobile Internet shopping
    • Deployment of more merchant terminals capable of accepting mobile transactions
    • Progress towards national rollout by Isis and Google Wallet consortia
    • Testing of standalone mobile payments apps by issuers (last week, U.S. Bank announced an iPhone payments pilot for new FlexPerks Travel Rewards Visa Signature cardholders)
  9. Fundamental shift in credit card positioning.  Prior to the financial crisis, credit cards were perceived by consumers (and positioned by issuers) as an easy way to access credit.  In recent years, as consumers cut card debt but continued to grow purchase volume, they have developed a more balanced perception of the credit card as both an efficient payments tool and flexible source of credit.
  10. Focus on nontraditional sales and service channels. Issuers will direct more of their marketing budgets to nontraditional customer acquisition channels, such as online and branch, which also have much lower cost-per-acquisition than direct mail. In addition, issuers will continue to develop new service functionality for both online and mobile channels.

Market-Specific Metrics Inform Bank Branch Network Investments

The emergence of virtual channels, the need to cut costs and speculation of more industry consolidation are all spurring banks to reconsider their branch networks.  Recently, EMI Strategic Marketing Inc. published blogs on the changing role of the branch, as well as trends in branch numbers for leading U.S. banks.

Banks have reiterated their commitment to the branch channel, but many are unlikely to maintain branch numbers at current levels.  Bank decisions of branch numbers and deployments are increasingly based on an analysis to the bank’s relative strengths in different markets.  Is the bank’s branch network spread too thinly, with few branches and low deposit shares in many markets?  Does it have critical mass in terms of branch numbers and/or deposit share in particular market? If it does not have sufficient scale at present, should it expand its branch network organically or through acquisition? Or should it leave some markets?

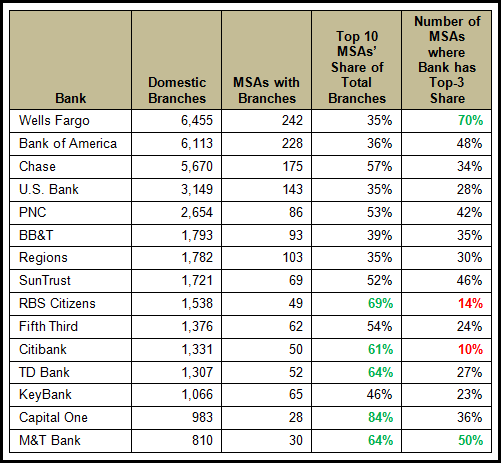
EMI Strategic Marketing Inc. analyzed end-2Q11 FDIC data on the branch footprint of the top 15 retail banks. (Note: this does not include M&A activity over the past year, such as PNC’s acquisition of RBC Bank.)  We focused on the number of metropolitan statistical areas (MSAs) where these banks had branches, branch concentration levels, and market strength indicators.

  • The banks with the most extensive branch networks are Bank of America and Wells Fargo, who both have branches in more than 200 MSA markets.
  • Regional banks naturally have a more concentrated branch presence.  RBS Citizens, PNC and M&T all have more than 60% of their branches in 10 markets.
    • RBS Citizens has top-three share in only 14% of the 49 markets where it has a physical presence.  Recent speculation indicates it may sell off its branch network in Illinois and Michigan.  The bank has branches in seven MSAs in these two states, but does not have a top-three deposit share in any of these markets.
  • Market strength: Wells Fargo has a top-three deposit share in 70% of its MSAs.   Four other banks (M&T, Bank of America, SunTrust and PNC) are ranked in the top three in more than 40% of their markets.
  • In late 2010, Citigroup announced that it would be concentrating on 16 U.S. metro markets.  This helps to explain why 61% of Citibank’s branches are in just 10 MSAs.  On the other hand, it has five or fewer branches in more than half of its markets.  Given its stated objective to concentrate its efforts on about 15 metro markets, we can expect Citibank to leave many of these markets where it has a token presence.  However, it will be aiming to significantly grow share in its target markets.
  • Capital One, which has built a retail branch presence in recent years through acquisition, has 84% of its branches in just 10 MSAs. (In fact, 57% of Capital One branches are in just two MSAs: Washington-Arlington-Alexandria, DC-VA-MD-WV and New York-Northern New Jersey-Long Island, NY-NJ-PA.)