Leading U.S. Banks’ Commitment to Marketing Investment Continued in 2024

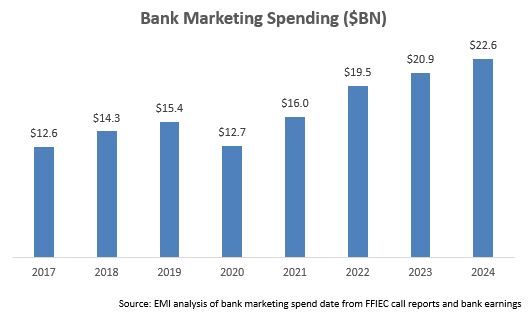
EMI Strategic Marketing performed a detailed analysis of advertising and marketing expenditures for c. 30 leading U.S. banks and found an 8% rise in spend in 2024, reaching more than $22.5 billion. Bank marketing spend was initially negatively impacted by COVID – falling 18% in 2020 – then it rebounded strongly by 26% in 2021 and 22% in 2022. The rate of growth has averaged 8% over the past two years, in line with a 9% CAGR since 2017.

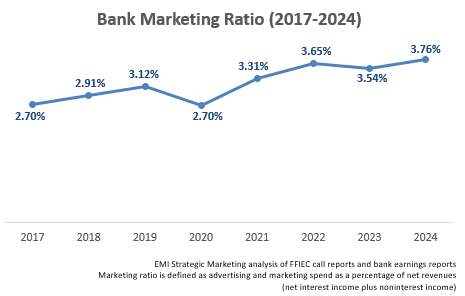
The bank marketing ratio (advertising and marketing spend as a percentage of net revenues) rose by 22 basis points to 3.76% in 2024. This ratio has grown well above pre-pandemic levels.

  • Traditional banks are investing to build their brands to support expansion into new geographic markets and new financial categories and to counter the growing threat from fintechs
  • Digital challengers like SoFi and LendingClub have made significant investments in marketing to build brand awareness

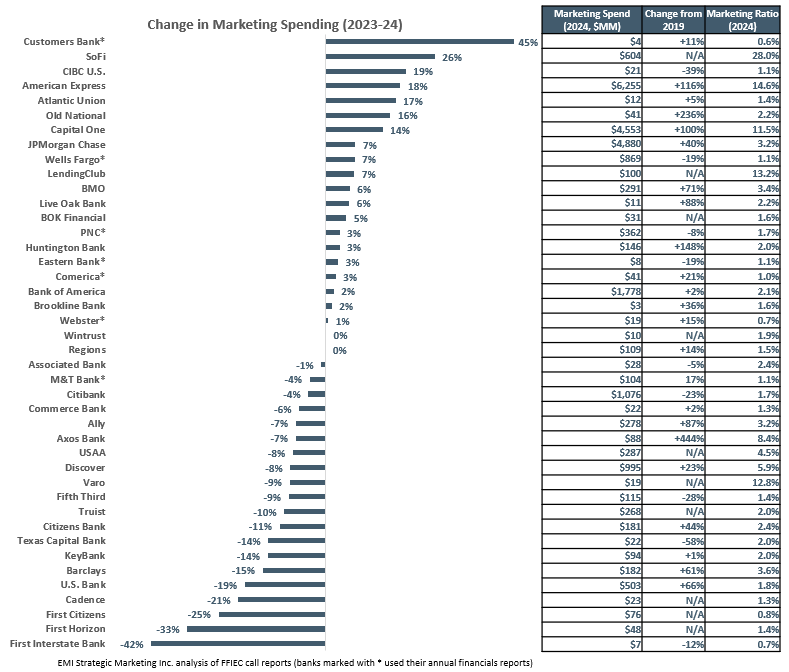
The overall rise in marketing spending was driven by leading financial advertisers like American Express (up 18% to $6.3 billion) and Capital One (up 14% to $4.6 billion). Both banks invested more than 10% of their net revenues on marketing. They were among the five banks – including JPMorgan Chase (up 7% to $4.9 billion), Bank of America (up 2% to $1.8 billion) and Citi (down 4% to $1.1 billion) – that spent more than $1 billion in marketing in 2024.

Although Citi was one of several banks that reduced their marketing budgets in 2024, it is important to apply a longer lens to some of the banks. For example, U.S. Bank reduced its advertising and marketing spend from $623 million in 2023 to $503 million in 2024. However, since its annual spend was less than $400 million between 2018 and 2022, its 2024 spend represents its continued strong commitment to marketing investment. The chart below shows the change in advertising and marketing by banks between 2023 and 2024 and also includes marketing ratios as well as change in spend from the years 2019 (pre-COVID) to 2024. (The extent and timing of advertising campaigns can also impact overall spend levels from year to year.)

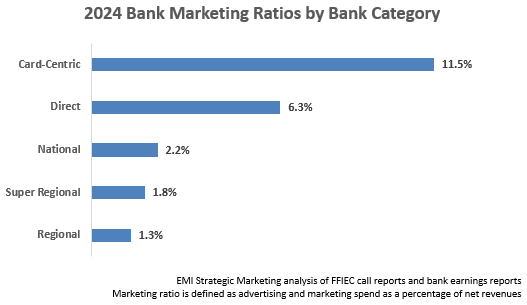
There is a significant difference in marketing ratios between different bank categories:

  • Card-Centric banks (e.g., American Express, Capital One, Discover) have high marketing ratios as they aggressively market credit cards (and in many cases personal loans) nationally.
  • Direct banks/fintechs (e.g., SoFi, Ally, Varo) need to build brand awareness in order to market their financial solutions nationally, and do not have the benefits – and the costs – of a branch network.
  • National banks like JPMorgan Chase and Bank of America look to build their brand across the U.S., while also devoting marketing to support their branch presence.
  • Super regional and regional banks concentrate more of their marketing resources within their footprints.

For 2025, we expect that bank marketing spending will continue to rise, based on:

  • Strong macroeconomic conditions
  • Increased consumer and business confidence
  • Digital challengers building their brands to raise awareness and win share from traditional banks
  • Traditional banks investing in established and emerging marketing channels to thwart competitive inroads from digital challengers, support expansion into new markets, and make up for the scaling back of branch networks in existing markets
FDIC Publishes Detailed Branch Data: Key Takeaways

The FDIC recently published detailed branch and deposit data for different geographic levels for all U.S. banks. EMI’s analysis of this data revealed the following trends:

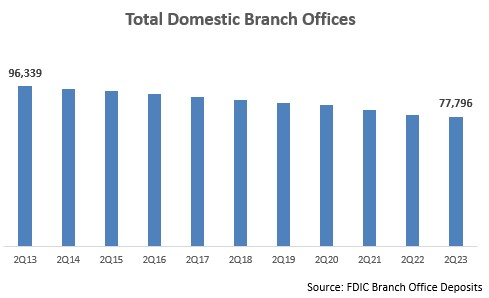
  • There is a continued (but slowing) decline in the number of bank branches. Over the past 10 years, the total number of domestic branches for FDIC-insured institutions declined by almost 24% to fewer than 78,000 branches. This equates to an annual average decline of 2.1%. In 2Q21 and 2Q22, the y/y rate of decline exceeded 3%, but this slowed to 1.7% y/y to the end of June 2023.
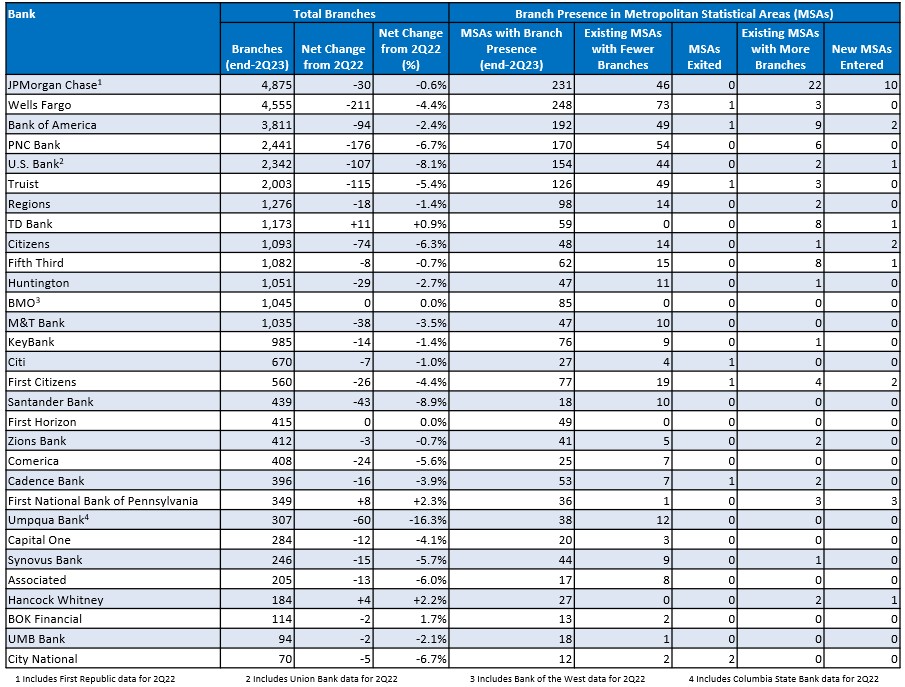
  • Some of the largest banks had the strongest percentage declines in branches. Our detailed analysis of 30 leading banks (see below) found a 3.1% y/y decline in branches (from 35,039 to 33,920) at the end of 2Q23. However four banks with networks of more than 2,000 branches reported declines of more than 4%: Wells Fargo (-4.4%); PNC (-6.7%); Truist (-5.4%) and U.S. Bank (-8.1%). Santander Bank reported the largest percentage decline (-8.9%).
  • Some banks are growing their branch networks. While the overall trend has been for banks to trim their networks, some banks are maintaining or even growing their commitment to this channel. TD Bank grew its network by 11 branches, adding branches in 8 existing markets, as well as opening its first branch in The Villages, FL. Following the collapse of its planned merger with First Horizon earlier this year, TD announced plans to open 150 U.S. branches by 2027 with a focus on Southeast markets.
  • Banks are maintaining their presence in the vast majority of their markets. While banks are reducing branch density in their existing markets, few are completely leaving these markets. Seven of the 30 banks exited a market over the past year, but only one left more than one market: City National Bank closed its branches in both Reno and Carson City, NV.
  • Branch closures were spread across many existing markets. Overall, the 30 banks closed branches in 22% of their existing markets, through several had higher percentages of existing markets impacted by closures, including Santander Bank (56%), Truist (39%) and PNC (32%).
  • Banks concentrated their reductions on markets with the largest branch networks. Banks reduced branch densities in many of their main markets, enabling them to cut costs while maintaining a significant presence. Although more than a third of Wells Fargo’s branch reductions took place in just 8 markets, each of those markets continues to have more than 100 branches.
  • Some banks are opening new branches in existing markets. The 30 banks increased branch numbers in 4% of existing markets, led by TD Bank (increased branch numbers in 14% of their existing markets) and Fifth Third (13%), who are both expanding their presence in key southeastern U.S. markets. JPMorgan Chase increased branch numbers in 22 markets (10% of its existing markets), including Washington (+11 branches), Minneapolis (+9), Kansas City (+7) and St. Louis (+7).
  • J.P. Morgan Chase is leading the way in market expansion. Over the past year, the bank opened branches in 10 new markets, including Buffalo and Virginia Beach (4 new branches in each market). This is part of a longer-term strategy to grow its branch footprint: the bank reported at its 2023 Investor Day that its population coverage rose from c. 60% in 2017 to c. 80% in 2022, with the bank now aiming for 85% population coverage.

Leading U.S. Banks Boosted Marketing Spend in 2022

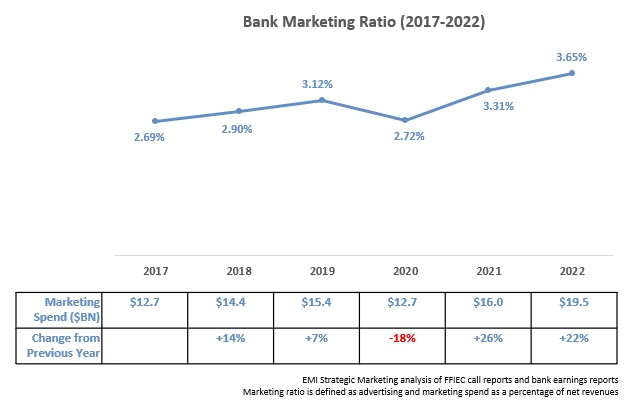
An EMI Strategic Marketing analysis of 30 leading U.S. banks found strong overall growth in marketing budgets for the second consecutive year. Following an 18% decline in 2020 in the midst of the COVID-19 pandemic, these leading banks have grown their marketing budgets by 53% over the past two years.

Five banks – American Express, Capital One, JPMorgan Chase, Citi and Bank of America – each spent more than $1 billion in advertising and marketing in 2022. Discover was just below this threshold.

These banks’ average marketing ratio (marketing spend as a percentage of net revenues) rose by 34 basis points (bps) to 3.65% in 2022.

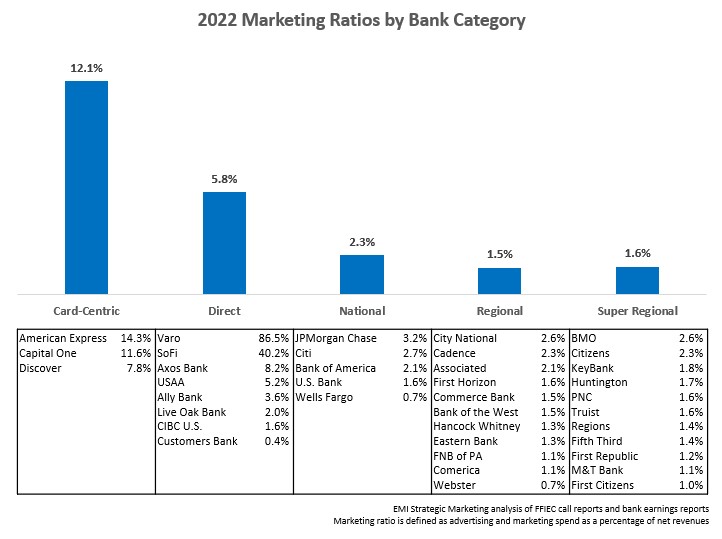
There is significant variation in bank marketing ratios between – and within – different banking categories.

  • Card-centric banks like American Express and Discover tend to have high marketing ratios as they have national reach but no branch networks.
  • Direct banks also have relatively high marketing ratios as they lack branch networks. Newer challenger banks are also investing significantly in marketing to build customers, deposits and assets.
  • More ‘traditional’ bricks-and-mortar banks typically have marketing ratios in the 1-3% range, although even in these categories we see significant variation as individual banks pursued different marketing objectives. Regional banks like Cadence Bank (+285% to $42 million) and BMO (+23% to $128 million) ramped up budgets in 2022 to promote brand overhauls. Super regional banks like Citizens (+38% to $184 million) and M&T Bank (+41% to $91 million) significantly grew their marketing spend to support entry into new markets following recent acquisitions.

Going into 2023, the projected trajectory for bank marketing spend is less clear, with rising inflation and slowing economic growth forcing banks to look for ways to reduce expenses. In addition, because they have grown budgets in recent years, some leading banks may decide to pause or even scale back their marketing budgets in 2023. However, many have stated their commitment to maintaining or even growing their marketing investment to support specific business strategies.

  • Discover expects double-digit growth in marketing spend as it pursues growth opportunities in credit card and deposits. It also claims that it continues to see strong returns on its investments.
  • Fifth Third plans to increase marketing spend in the mid-single digits in 2023 as it targets customer acquisition in the Southeast.
  • Axos Bank is maintaining higher spend levels as it seeks to grow deposits in an increasing competitive market.