According to the latest FDIC Quarterly Banking Profile, U.S. credit card loan growth accelerated in 4Q17, rising 8.2% to $865 billion.

Given the strong overall growth in credit card receivables, are issuers focusing their growth ambitions on particular FICO Score categories? To address this question, EMI analyzed 10K SEC filings for leading credit card issuers. Overall, we found that issuers reported strong credit card loan growth across their FICO Score segments. We also studied trends in different issuer categories.
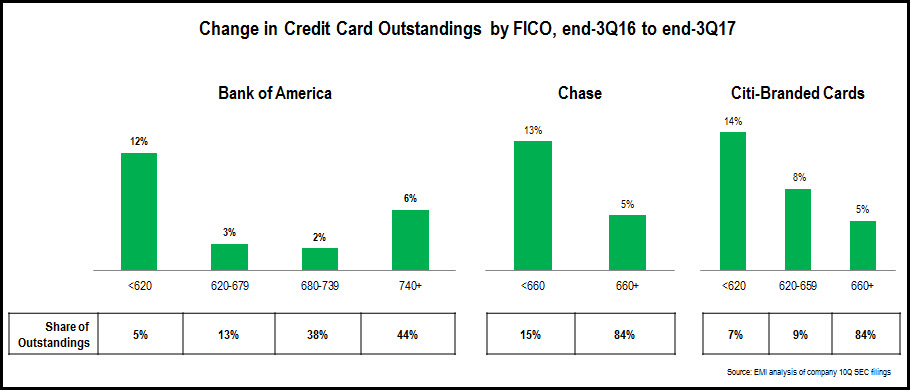
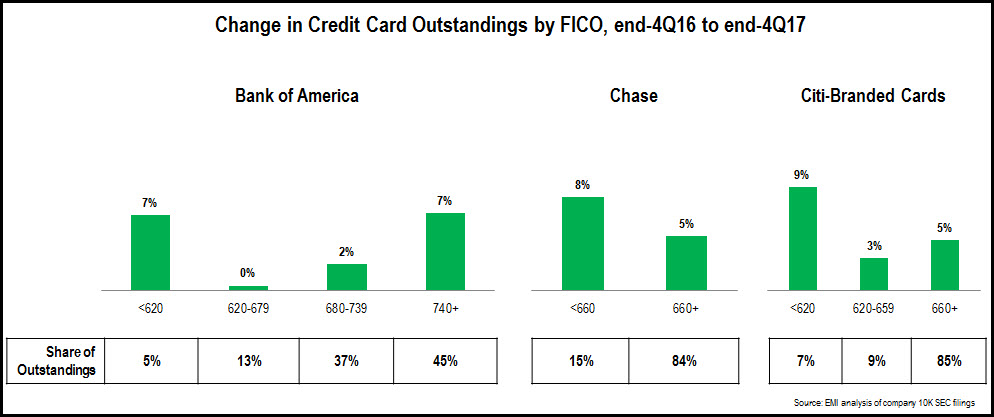
- In the aftermath of the Financial Crisis, the three leading issuers—Chase, Bank of America and Citi—focused attention away from near-prime and sub-prime segments and towards superprime consumers. This led to significant declines in both outstandings and charge-off rates. More recently, as economic growth and consumer confidence returned, these issuers have refocused on loan growth and are once again targeting lower FICO Score segments. This is seen in the chart below that shows changes in outstandings by FICO Score segment between end-2016 and end-2017. As these issuers are pursuing loan growth, their credit card net charge-off rates have also increased (+26 bps y/y at Bank of America, +30 bps to at Chase, +59 bps at Citi-Branded Cards North America). However, charge-off rates remained below 3% for each of these issuers in 4Q17, and issuers should continue to focus on loan growth while charge-off rates continue at these low levels.
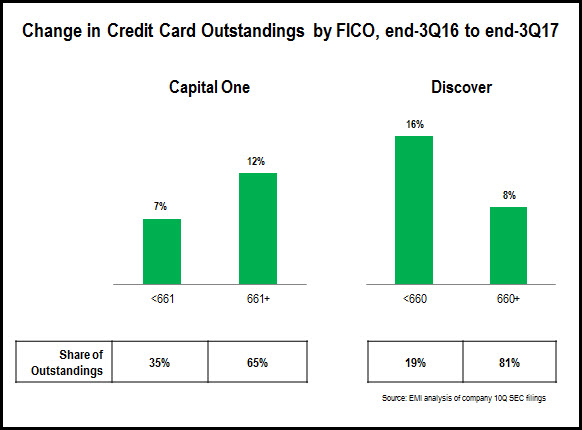
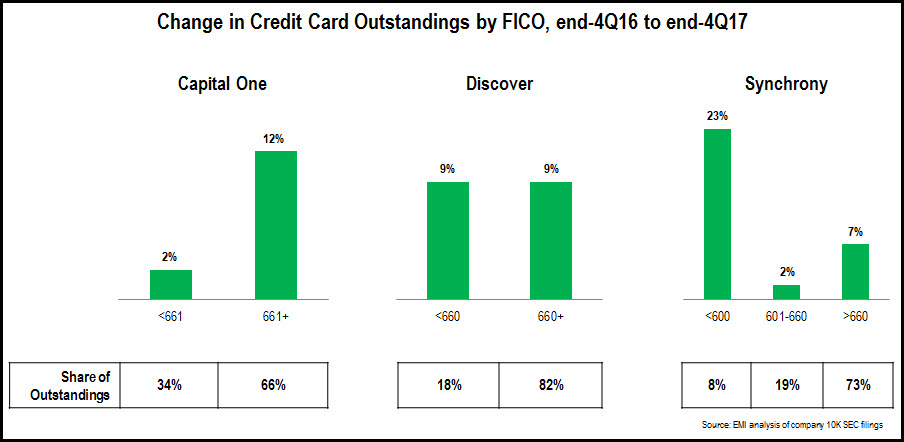
- Second-tier national credit card issuers—Discover, Capital One and Synchrony—reported relatively strong growth, but with different FICO Score segment trends. Discover reported 9% y/y growth, with no y/y change in share of outstandings for the <660 and 600+ segments. Capital One had a similar overall growth rate (8%), but this was driven in part by the acquisition of the Cabela’s card portfolio, which boosted the >660 FICO segment’s share of outstandings. It is also worth noting that the <660 FICO segment accounted for 34% of Capital One’s credit card portfolio at the end of 2017, compared to 25% of Synchrony’s portfolio, and 18% at Discover.
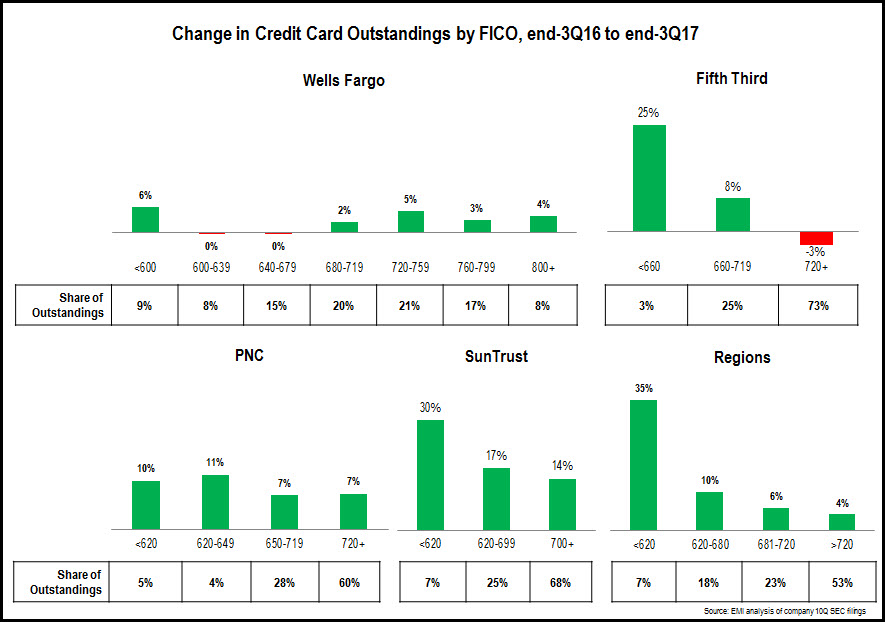
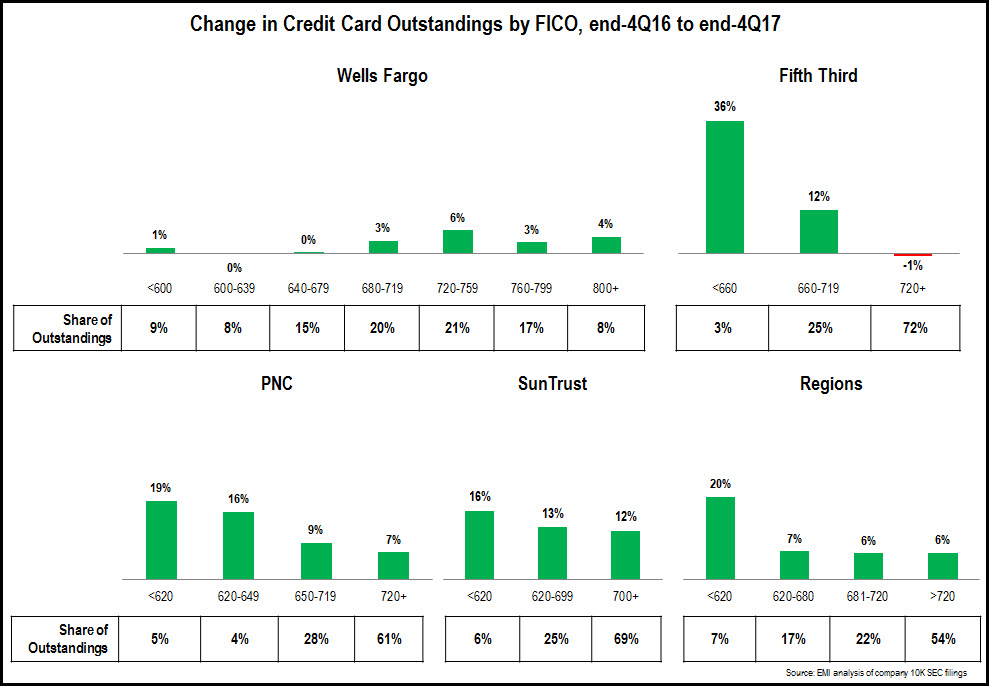
- Regional credit card issuers present a mixed picture when it comes to the FICO Score segment composition of their credit card portfolios. This is driven by a number of factors, including a large variation in portfolio sizes, as well as their credit card underwriting standards. Most issuers report growth across their portfolios, with strong growth rates in the low FICO Score segments. Fifth Third reported very strong growth for its <660 segment, but this segment only accounts for 3% of its portfolio. Regions’ 20% growth in its <620 FICO segment was driven by its launch of a credit secured card in July 2017.
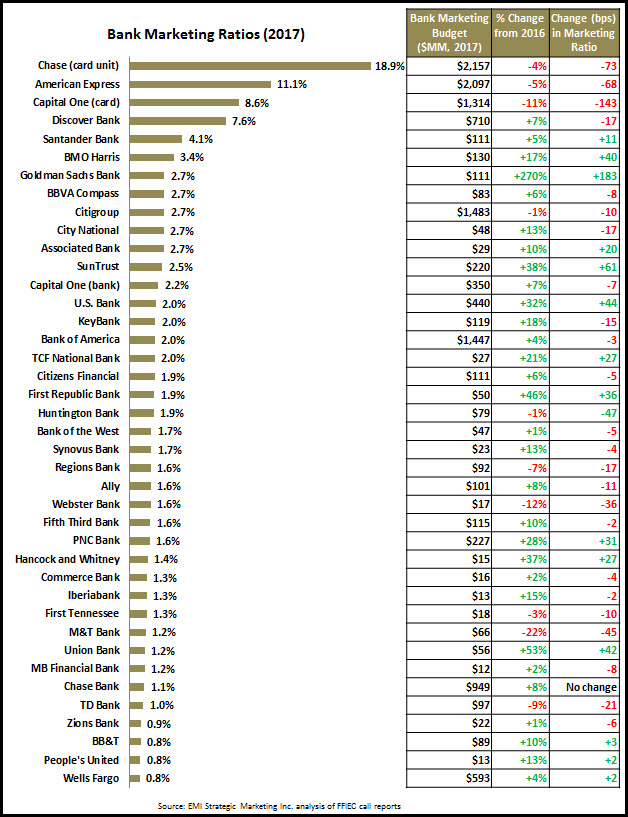
Finally, as most issuers reported strong growth in their credit card portfolios in 2017, charge-off rates are also on the rise, growing 45 bps y/y to 3.61% at the end of 2017. While the overall charge-off rate has risen from a low of 2.19% in 3Q15, it is down both from post-recessionary highs of 13.13% in 1Q10, and even the 4% levels in 2007, prior to the Financial Crisis. With charge-off rates still below 4%, the leading issuers continue to be comfortable with promoting credit card loan growth.