7 Ways Banks Are Adapting Branch Networks to New Realities

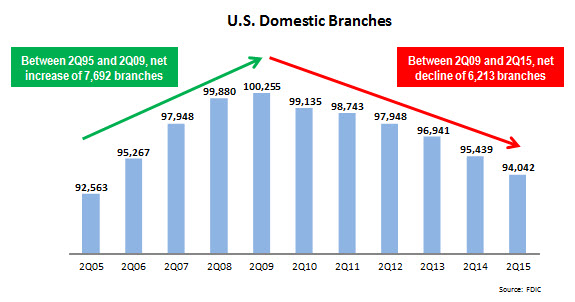
According to the FDIC, there were just over 94,000 domestic bank branches at the end of June 2015: a net reduction of almost 1,400 branches from end-June 2014, and a decline of more than 6,000 branches since the U.S. passed the 100,000 branch threshold in mid-2009.

domestic_branches_2Q05-2Q15

The recent decrease in the number of branches is being driven by a number of factors, including banks’ focus on cutting costs in recent years.  In addition, the emergence and strong growth of online and mobile banking usage has led to consumers significantly reducing their use of branches for transaction processing.  So how are banks adapting their branch networks to this changing channel environment?  An analysis of presentations by leading U.S. banks at the recent Barclays Global Financial Services Conference identified a number of ways that banks are restructuring, repositioning, redesigning and restaffing their branches to ensure that this channel survives and thrives into the future.

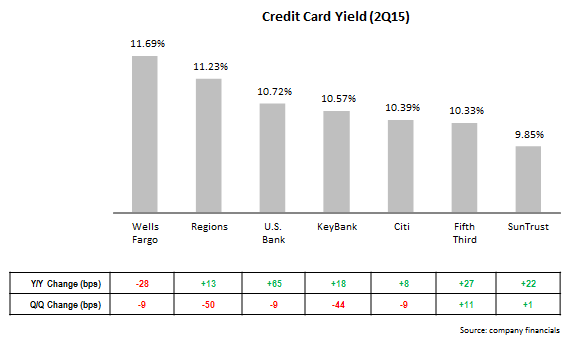
  • Continuing to pursue branch consolidation.  While banks continue to emphasize their commitment to the branch channel in general, they have cut their overall number of branches in recent years, and will continue to do so.  At the Barclays conference, KeyBank reported that it had cut its branch network by 10% in the past three years, and envisages a further ongoing reduction at a rate of 2-3% per year.
  • Selling off (and acquiring) branch networks.  Most leading banks believe they need to have critical mass in particular markets.  If they feel that they cannot achieve this goal, they may decide to exit the market entirely.  Citi is exiting a number of markets, as it seeks to focus on just 6 major metro markets.  Fifth Third recently announced that it is ending its branch presence in Pennsylvania.  These branch sell-offs create opportunities for other banks who want to grow their presence in those markets (BB&T acquired Citi’s branch network in Texas, and F.N.B is  buying Fifth Third’s 17 branches in Pittsburgh).
  • Developing a hub-and-spoke approach.  Rather than having a dense network of similarly-sized branches, some banks are looking to establish a hub-and-spoke approach in specific markets.  This approach typically features a flagship branch as well as a reduced number of small branches.  At the Barclays conference, Synovus claimed that it was applying a hub-and-spoke system.  Other banks with flagship branches include Bank of America and Citibank, which now has flagship branches in four of its six target U.S. metro markets.
  • Redesigning and re-staffing branches.  As the branch channel’s primary role shifts from transaction processing to sales and service, leading banks are overhauling store layouts and are replacing tellers with product experts.  In addition to closing or consolidating 400 branches in recent years, PNC reported that it has converted 300 branches to its universal banking model (featuring concierge stations and reformatted teller stations).  In addition to providing enhanced sales and services to branch visitors, PNC claims that these branches cost 45% less than traditional branches.  In terms of staffing, Bank of America reported that it has added nearly 1,200 financial solutions advisers and small business bankers over the past two years.
  • Growing in-store branch networks.  Banks like Huntington and U.S. Bank have significant in-store or on-campus branch networks, and remain committed to this channel.  Huntington Bank recently announced that it was adding 43 in-store branches in Michigan via its relationship with Meijer Stores.
  • Incorporating new functionality into online and mobile banking services to drive branch traffic. Bank of America reported that its clients used the bank’s online and mobile apps to schedule an average of 14,000 branch appointments per week in August 2015.  And in September 2015, Bank of America announced online and mobile banking enhancements, which included enabling clients to make same-day financial center appointments.
  • Applying guerrilla marketing tactics.  Banks are becoming more creative in how they establish a physical presence to better interact with clients and prospects.  Leveraging its relationship with the Green Bay Packers, Associated Bank has set up a virtual branch in the parking lot of Lambeau Field to target tailgaters.

While the overall number of branches is likely to continue to decline, most banks appreciate the key role that branches play in sales, service and branding, and remain committed to the channel.  However, banks will continue to adjust branch density, design, layout, staffing and integration with other channels, in order to control costs and adapt to new consumer preferences and behaviors in how they interact with their banks.

Credit Card Issuers Increase Focus on the Subprime Market

The American Banker Association’s September 2015 Credit Card Market Monitor found a 28% y/y rise in new subprime accounts, indicating that issuers are expanding their focus as they seek to grow revenues. An analysis by EMI Strategic Marketing of the FICO composition of credit card outstandings at the end of 2Q15 finds that many leading card issuers are accelerating growth in sub-prime and low-prime outstandings.

  • In recent years, Wells Fargo has reported strong y/y growth in all FICO categories.
    • In its <600 FICO category, growth has accelerated to double-digit rates in the past three quarters.
    • Its 600-639 FICO category has grown by double-digit rates in six of the past seven quarters.

wells_fargo_subprime_outstandings

  • Among national credit card issuers, Bank of America’s subprime outstandings declined 9% y/y in 2Q15, but the rate of subprime loan decline has been steadily slowing in recent quarters.  However, Citi’s subprime outstandings growth performance is less consistent, with y/y growth from 4Q13 to 2Q14 followed by declines for the past four quarters.

BofA_subprime_outstandings

  • There are also mixed trends when analyzing subprime outstandings performance of regional bank card issuersPNC reported a 6% y/y decline in <620 FICO outstandings in 2Q15, compared to a rise of 1% in 1Q15.  Regions reported strong growth in <620 FICO in recent quarters (double-digit y/y rises between 2Q14 and 1Q15), but this fell to just 2% in 2Q15.  However, it should be noted that Regions’ total subprime outstandings were just $49 million, so variations in growth rates are not unexpected.  SunTrust reported double-digit y/y increases in subprime outstandings for three of the past four quarters.

regional_bank_card_subprime_outstandings

EMI’s analysis also shows that subprime outstandings growth continues to trail prime and superprime outstandings growth for several reasons:

  • The large national issuers continue to deal with legacy issues following the financial crisis.
  • For issuers in general, underwriting standards continue to favor superprime consumers.
  • And even though many issuers are ramping up subprime account production, it will take some time before it translates into strong growth in subprime outstandings.

BofA_citi_credit_score_2Q15

regional_bank_card_issuer_credit_score_2Q15

Meanwhile, an analysis of FDIC data for the 2Q15 shows strong outstandings growth for subprime credit card specialists, including Comenity (+23% y/y) and Merrick Bank (+16%). As the card industry in general increase its focus on the subprime market, it will be interesting to see if the acceleration in subprime outstandings growth among some regional bank card issuers is replicated by the large national issuers.  In addition, growth in subprime credit card outstandings should result in delinquency and charge-off rates rising from their current historically low levels.

10 takeaways from leading credit card issuer 2Q15 financials

The major U.S. credit card issuers have now published their quarterly financials.  A review of these reports by EMI revealed the following 10 trends:

  1. Outstandings are growing. Credit card loan growth is once again being led by regional bank card issuers (such as SunTrust and Wells Fargo who tend to cross-sell cards to existing bank customers), as well as card “monolines” (such as Capital One and American Express). Banks with national credit card operations report lower growth (or even declines) as a result of the lingering effects from the financial crisis, runoff of promotional rate balances, as well as high payment rates. But even here we are seeing signs of growth: although Bank of America reported a 1% y/y decline in average outstandings, it also reported its largest quarter for new account origination since the fourth quarter of 2008.
    card_outstandings_2Q14-2Q15
  2. Volume continues to grow, but with some slowdown. Some leading issuers continue to grow volume at double-digit rates (Wells Fargo grew loans and volume by 15%, boosted in part by the bank’s acquisition of the Dillard’s portfolio). Other issuers had lower volume growth, and many pointed to the impact of lower gas prices. For example, Discover reported volume growth of just 2%, but absent gas prices, this growth was 5%.card_volume_2Q14-2Q15
  3. Net charge-off rates continue to decline to historic lows. For many leading issuers, net charge-off rates are well below historic norms. In addition, the rates continue to decline; of the 13 issuers studied, 12 reported year-on-year charge-off rate declines.
    card_charge-off_rate_2Q15
  4. 30+ day delinquency rates are also declining. Delinquency rates tend to be a leading indicator of future charge-offs, so it is notable that 30+ day delinquency rates continue to decline.
    delinquency_rate_2Q14-2Q15
  5. The profit picture is mixed for issuers. Six leading issuers provide credit card profitability data, as they operate standalone payment units. Four of the six issuers reported y/y declines in profitability as growing expenses exceeded revenues. However, Chase increased net income  for its Card Services unit by 33%, driven by lower costs (9% decline in noninterest expense, and 10% fall in provision for loan losses). American Express grew its U.S. Cards net income by 15%, as revenue growth of 6% and a 4% decline in provisions exceeded a 4% increase in noninterest expense.
  6. Growth in lending and volume are driving revenue growth. In the wake of the 2008 Financial Crisis and subsequent industry retrenchment, credit card industry revenues fell significantly. As the economy stabilized and then grew, leading issuers continued to struggle to attain revenue growth. Now the return to outstandings growth, as well as continued loan growth, is finally enabling issuers to increase revenues.
    revenues_2Q15
  7. To support this revenue growth, card issuers’ noninterest expenses are increasing. The rise in revenues is driving growth in expense areas like marketing and rewards costs. Of the five issuers providing noninterest expense data, four reported y/y increases, led by Discover (+18%) and U.S. Bank (+13%).
  8. Provisions for loan losses are (mainly) decreasing. As net charge-off and delinquency rates continue to decline, three issuers reported y/y declines in their provisions for loan losses. However, Capital One and U.S. Bank increased provisions, with Capital One growing provisions by 69%.
  9. Issuers are increasing credit card yield. Of the seven leading issuers who reported card yield in their financials, six reported y/y growth. The exception was Wells Fargo, which had the highest yield in 2Q15. However, five of the seven reported q/q declines; the exceptions were Fifth Third and SunTrust, which had the lowest yield among reporting issuers.
    card_yield_2Q15
  10. Issuers are using a range of channels for new account acquisition. In general, cards issuers are continuing to reduce their dependence on direct mail for new card acquisition, and are focusing more investment on digital and branch channels. Chase reported that its online channel accounted for 62% of new card accounts in 2Q15. Even though Citi is continuing to cut its U.S. branch network, it reported that credit card acquisition via branches was up 10% on a same-store basis.