Leading U.S. banks cut marketing spend in 1Q13

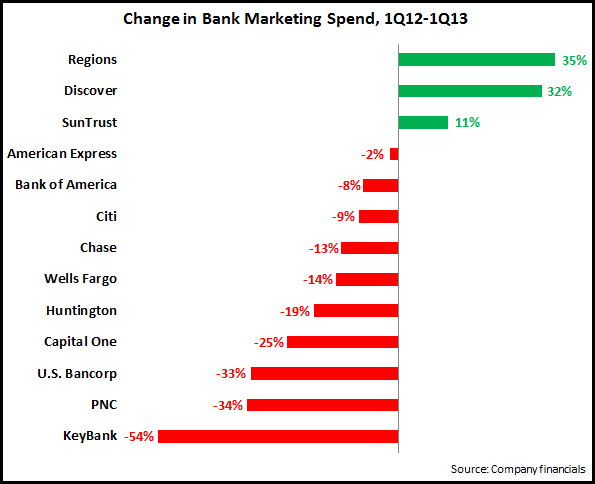
A study of the financial reports for 13 leading U.S. financial institutions reveals that 10 of these FIs reported y/y decreases in their advertising/marketing spending in the first quarter of 2013, with 7 of these banks reporting double-digit percentage decreases.

Much of this is driven by bank-wide cost-cutting initiatives, with marketing typically one of the expense line items that is most susceptible to cuts.  However, it is important not to take one quarter’s worth of data as a trend.  This is particularly true for bank marketing spending, which fell significantly following the financial crisis in 2008, but recovered somewhat from 2010. A recent EMI blog showed that 7 of 11 leading U.S. banks increased their marketing spend between 2007 and 2012. For example, PNC reported a strong decline in marketing spending between 1Q12 and 1Q13, but this followed a very strong rise in spending from 2007 to 2012.

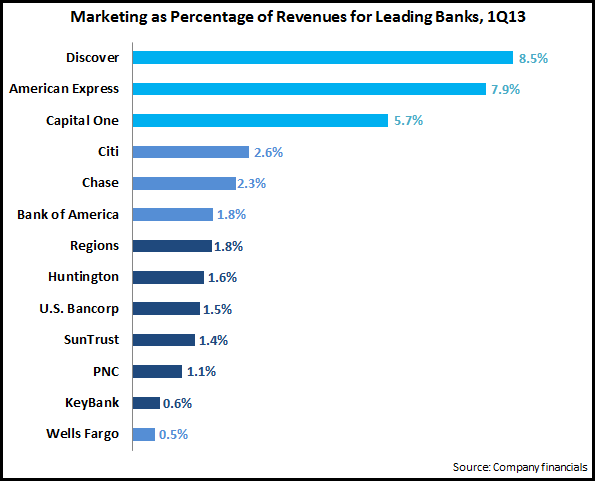
Another way to study bank marketing spend is to look at marketing spend intensity, which we define as marketing spend as a percentage of revenues.

The chart above reveals that in terms of marketing spend intensity, there are three distinct segments:

  • Current (Discover and American Express) and former (Capital One) credit card monolines. In particular, Discover and American Express have limited banking operations, so remain quite dependent on their credit card business, which tends to have higher marketing spending than other financial services. In addition, Discover and American Express lack branch networks, so they need to have higher levels of advertising spend to maintain strong brand awareness.
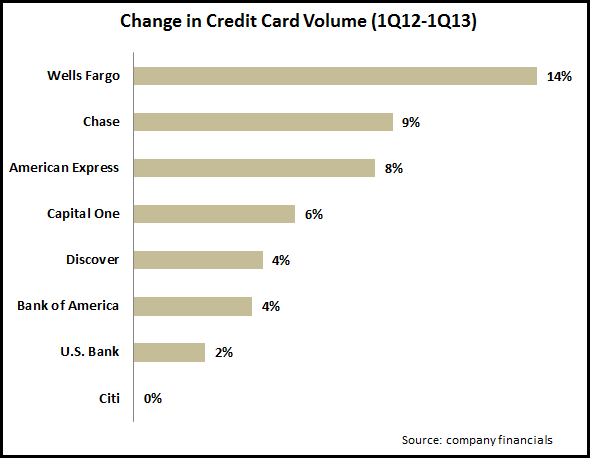
  • National banks (Citibank, Chase, and Bank of America), which typically devote 2-3% of revenues on marketing. These banks tend to have higher advertising to support their brands nationwide. In addition, these banks have large credit card operations. An exception is Wells Fargo, which spends only 0.5% of revenues on marketing. Wells Fargo has a national branch presence, but has a limited credit card business (unlike the other banks, it only markets credit cards to existing bank customers).
  • Regional banks, who spend 1-2% of revenues on marketing.

Finally, it is difficult to prove a correlation between marketing spending and bank growth, as many factors influence customer acquisition and revenue growth.  It is worth noting that banks continue to struggle to generaterevenue growth (7% of the 13 banks reported revenue declines between 1Q12 and 1Q13).  However, the three banks with the highest marketing intensity (Discover, American Express and Capital One) were among the 6 banks that did generate y/y revenue growth.

Slowdown in U.S. Payment Volume Growth for Leading Card Networks

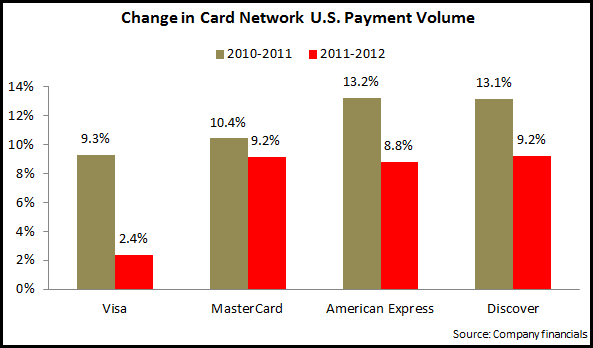
With Visa and MasterCard reporting their quarterly financials this week, we now have a picture of U.S. payment volume for the four main card networks (Visa, MasterCard, American Express and Discover) in 2012.  These four networks grew volume 5.3% in 2012.  This represented a significant decline from the 10.3% growth rate between 2010 and 2011.

  • Visa reported the largest decline in its volume growth rate, from 9% in 2011 to just 2% in 2012.  While U.S. credit card volume growth remained stable at 10% in both 2011 and 2012, debit card volume fell from a growth rate of 9% in 2011 to a volume decline of 2% in 2012.  This was largely due to new regulations that impacted Visa’s exclusive debit card network relationships with banks.  Visa did report significant improvements in y/y growth rates for both credit and debit volume between 3Q12 and 4Q12.
  • MasterCard credit and charge volume growth fell from 6% in 2011 to 3% in 2012 (although the y/y growth rate improved from 1% in 3Q12 to 3% in 4Q12).  Debit volume rose from 12% in 2011 to 15% in 2012.
  • American Express reported its U.S. consumer payment volume fell from 11% in 2011 to 8% in 2012.  During this period, small business volume slipped from 14% to 12%, while corporate services volume declined from 14% to 11%.
  • Discover reported declines in growth rates for its two main payment volume categories: proprietary Discover Network (from 8% to 5%); and PULSE Network (from 19% to 14%).

According to the U.S. Bureau of Economic Analysis, personal consumption expenditure rose 3.6% between 2011 and 2012, down from 5.0% between 2010 and 2011.  This means that even though card networks’ volume growth slowed between 2011 and 2012, it was still stronger than consumer spending, and so the networks’ share of consumer spending continued to rise.  We expect that volumes will continue to rise at moderate levels in 2013, as the leading U.S. issuers seek to balance volume and lending growth.

Perspectives on Bank Marketing Spending

Directions in bank marketing spend have become more difficult to predict, as banks seek to balance the need to control costs with the desire to capture growth opportunities. Bank marketing spending trends for 2012 show these forces in action. Many large banks now have multi-year expense reduction in programs in place. However, there is growth potential in a number of lending categories (e.g., commercial, mortgage, and auto).

The chart above shows a mixed picture, with double-digit declines in marketing spending for Chase and Bank of America, but double-digit growth by KeyBank , PNC and Discover Financial. So, at first glance, it appears that the largest banks are cutting their marketing budgets, while some regional banks are ramping up their investment.

However, this just provides one year’s worth of data. Taking a longer-term view, the next chart looks at changes in bank marketing spending between 2007 (just prior to the onset of the financial crisis) and 2012.

This gives us a rather different picture, with 7 of 11 banks increasing their marketing spend over the five-year period. And different stories emerge for particular banks as we take the longer-term view.

  • KeyBank’s $68 million in marketing spend is 13% higher than 2011, but 11% lower than the $76 million it spent in 2007.
  • JPMorgan Chase had the largest decline between 2011 and 2012 (-18%), but its $2,577 million spend level in 2012 represented a 24% increase over 2007 levels (and in fact, there were significant shifts in spending during this period, with a 14% fall between 2007 and 2009, followed by a 77% rise between 2009 and 2011).

Even this five-year view does not give us a full picture, as the financial crisis has meant that many banks have changed radically between 2007 and 2012. For example, Wells Fargo and JPMorgan Chase have grown significantly, in large part due to the acquisitions of Wachovia and Wamu, respectively. On the other hand, Citigroup and Bank of America, two of the banks hardest hit by the financial crisis, have embarked on a long-term project to sell off non-core assets.

With this is mind, a more effective way to compare bank marketing spend levels is to look at bank marketing spend intensity (marketing spend as a percentage of revenues).

Taking this viewpoint, we can decipher a number of trends:

  • Banks that lack a retail branch presence (such as American Express and Discover) have the greatest marketing spend intensity. American Express recently reported that, even as it looks to reduce expenses (with plans announced in January 2013 for 5,400 job cuts), it plans to maintain marketing spend at 9% of revenues.
  • Next in bank marketing spend intensity are banks like Capital One and Citigroup, which have national lending franchises but relatively small branch networks. In the case of Capital One, its marketing spend intensity has declined in recent years, from 9.2% in 2007 to 6.4% in 2012. This has coincided with its transition from a monoline credit card provider to a more full-service bank.
  • National banks with extensive branch networks and a full range of services (JPMorgan Chase, Wells Fargo and Bank of America) tend to spend the equivalent of 2-3% of revenues on marketing. There has been some reduction in marketing spend intensity by these banks in recent years, most notably by Bank of America, whose marketing spend as a percent of revenues fell from 3.6% in 2007 to 2.2% in 2012. Wells Fargo stands out from its national bank peers, with marketing spend intensity below 1%.
  • Regional banks’ marketing spend intensity tends to be lower than other bank segments, at 1-2% of revenues.

In summary, bank marketing spend levels are set within ranges that are defined by the bank’s size, structure and product focus. Within these ranges, banks increase or decrease marketing spending from year to year based on both their strategic priorities as well as their assessment of their operating environment.