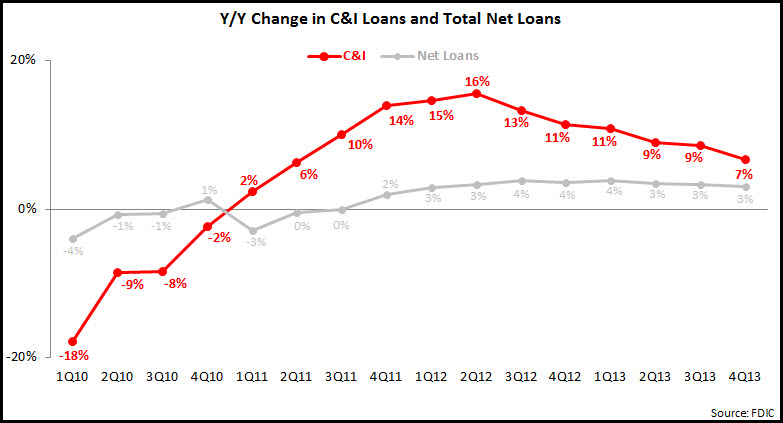
The FDIC recently published detailed bank data as of end-4Q13. This data revealed that U.S. banks are continuing to grow their commercial and industrial (C&I) loan portfolios, although the y/y growth rate has been steadily declining, from a high of 16% in 2Q12 to 7% in 4Q13. C&I loan portfolios declined significantly following the financial crisis, reaching a low of $1.2 trillion in 2Q10. Since then, C&I loan portfolios have grown 38%, and have driven overall U.S. loan growth. The recent deceleration in the C&I loan growth rate had reduced the gap between C&I loan growth and overall net loan growth, from a high of 12.3 percentage points in 2Q12 to 3.7 percentage points in 4Q13.
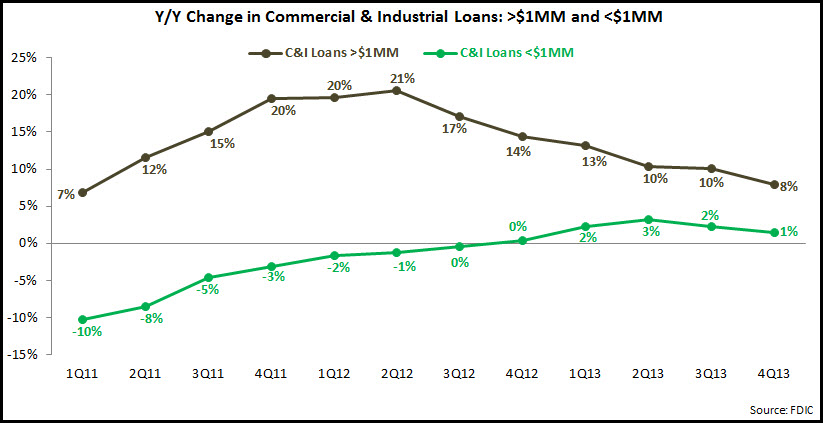
 Within C&I loan portfolios, overall growth has been driven by individual loans valued at more than $1 million. Mirroring overall C&I loan portfolios trends, y/y growth for >$1MM loans peaked at 21% in 2Q12, and has been declining since then. Meanwhile, small business loan portfolios (C&I loans with initial values of <$1 million) only started to report y/y growth at the end of 2012. This growth rate reached 3% in 2Q13, but has slowed since, to 1.4% at the end of 2013. This slow recovery in small business lending has been due to both tight bank underwriting (which is only now beginning to ease), as well as low demand for small business loans due to uncertainty regarding the prospects for economic recovery. Interestingly, within this C&I loan <$1MM segment, strongest growth is being seen in the <$100K loan segment, which includes small business credit card loans. This <$100K portfolio rose 4.2% y/y in 4Q13, up from 2.9% in 3Q13.
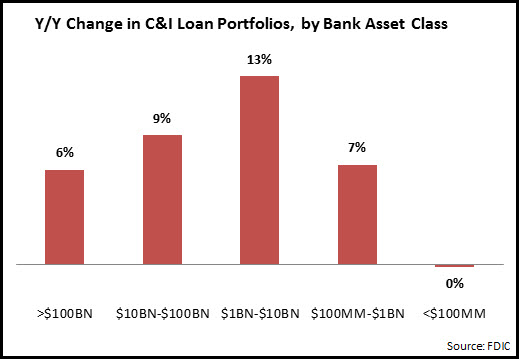
 Strongest growth in C&I loans between end-2012 and end-2013 was reported by mid-sized banks with $1-$10BN in assets. The largest banks (>$100BN in assets) had trailed the industry average, as banks like JPMorgan Chase and Wells Fargo reported anemic loan growth. C&I loan portfolios for small community banks (<$100MM in assets) were unchanged y/y, as they struggle to compete with the broad commercial product range and cutting-edge online and mobile tools on offer from the larger banks.
 Given the slowdown in the growth of C&I loan portfolios, how can individual banks continue to build their commercial loan portfolios?
-
Target specific geographic markets or vertical industry segments, where the bank already has—or can quickly create—dedicated capabilities
-
Re-commit to the small business segment
-
Develop initiatives to increase commercial loan utilization rates (which continue to trail historic averages for many banks)
-
Identify and dedicate resources to capture growth in other loan categories, which have been ignored in recent years
