U.S. Banks Maintain Commercial Lending Momentum in 1Q13

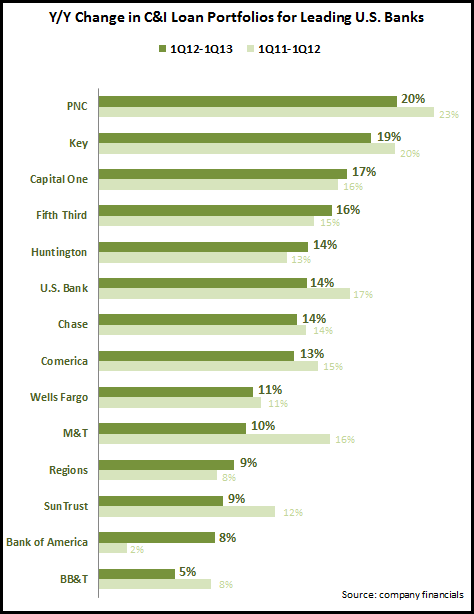
EMI analysis of recently-published financial results for 14 leading U.S. banks revealed that that strong growth in commercial and industrial (C&I) loan portfolios continued in the most recent quarter. These banks grew their C&I loan portfolios by an average of 12% y/y, which was the same growth rate as in 4Q12, and up from an 11% portfolio growth rate in 1Q12.

Strongest growth was reported by regional banks like PNC (boosted by the acquisition of RBC Bank), KeyBank, Fifth Third and Huntington, as well as Capital One. However, it is worth noting that 9 of the 14 banks reported lower C&I loan y/y growth rates in 1Q13 vs. 1Q12. The overall growth rate increased from 11% to 12% during this period, as Bank of America (which has the largest C&I loan portfolio) increased its C&I loan y/y growth from a paltry 2% in 1Q12 to a more robust 8% in 1Q13.

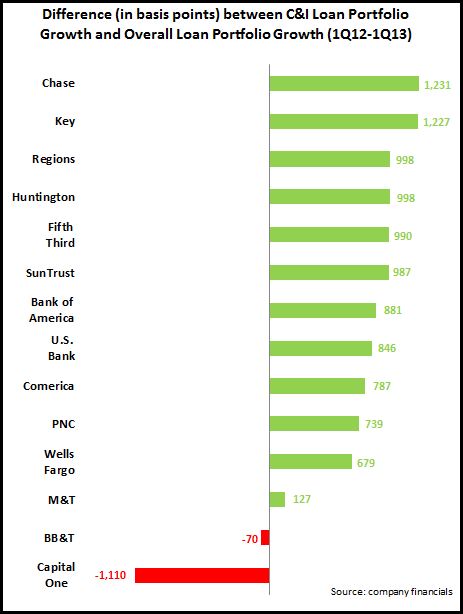
The bar chart below shows that gap between C&I and overall average loan portfolio growth rates, with 12 of the 14 banks reporting higher C&I loan growth. The bank with the largest gap was Chase, which grew average commercial banking loans by 13.7% y/y, while its overall loan portfolio only grew by 1.3%. The two exceptions were Capital One (whose non-C&I growth was boosted by some recent acquisitions) and BB&T. In fact, three banks (Regions, SunTrust and Bank of America) reported declines in their total loan portfolios between 1Q12 and 1Q13, even though C&I loan portfolios rose by high single-digit rates.

C&I loan charge-off rates continue to improve, with an average rate of 0.22% in 1Q13, down 19 basis points (bps) y/y and a reduction of 7 bps from the previous quarter. However, there is evidence that competition for C&I loans continues to increase, with an average yield of 3.63% in 1Q13, which represents declines of 40 bps y/y and 9 bps q/q. A recent EMI blog identified a number of banks that are leveraging innovative marketing approaches to differentiate from competitors in this increasingly competitive space.
Leading U.S. banks cut marketing spend in 1Q13

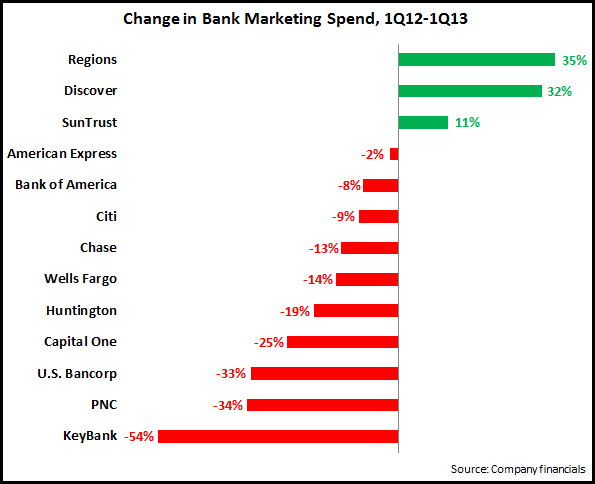
A study of the financial reports for 13 leading U.S. financial institutions reveals that 10 of these FIs reported y/y decreases in their advertising/marketing spending in the first quarter of 2013, with 7 of these banks reporting double-digit percentage decreases.

Much of this is driven by bank-wide cost-cutting initiatives, with marketing typically one of the expense line items that is most susceptible to cuts.  However, it is important not to take one quarter’s worth of data as a trend.  This is particularly true for bank marketing spending, which fell significantly following the financial crisis in 2008, but recovered somewhat from 2010. A recent EMI blog showed that 7 of 11 leading U.S. banks increased their marketing spend between 2007 and 2012. For example, PNC reported a strong decline in marketing spending between 1Q12 and 1Q13, but this followed a very strong rise in spending from 2007 to 2012.

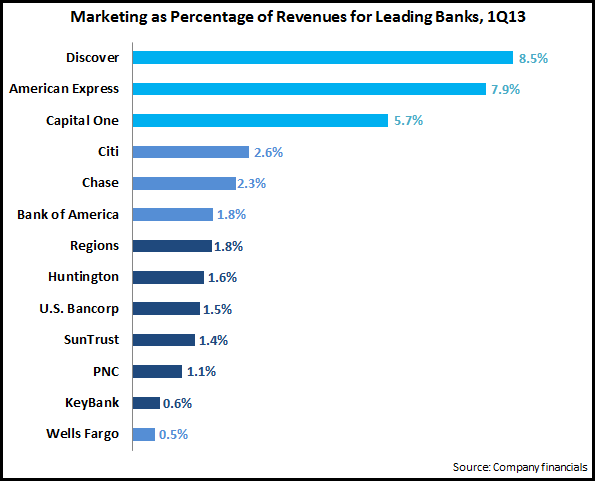
Another way to study bank marketing spend is to look at marketing spend intensity, which we define as marketing spend as a percentage of revenues.

The chart above reveals that in terms of marketing spend intensity, there are three distinct segments:

  • Current (Discover and American Express) and former (Capital One) credit card monolines. In particular, Discover and American Express have limited banking operations, so remain quite dependent on their credit card business, which tends to have higher marketing spending than other financial services. In addition, Discover and American Express lack branch networks, so they need to have higher levels of advertising spend to maintain strong brand awareness.
  • National banks (Citibank, Chase, and Bank of America), which typically devote 2-3% of revenues on marketing. These banks tend to have higher advertising to support their brands nationwide. In addition, these banks have large credit card operations. An exception is Wells Fargo, which spends only 0.5% of revenues on marketing. Wells Fargo has a national branch presence, but has a limited credit card business (unlike the other banks, it only markets credit cards to existing bank customers).
  • Regional banks, who spend 1-2% of revenues on marketing.

Finally, it is difficult to prove a correlation between marketing spending and bank growth, as many factors influence customer acquisition and revenue growth.  It is worth noting that banks continue to struggle to generaterevenue growth (7% of the 13 banks reported revenue declines between 1Q12 and 1Q13).  However, the three banks with the highest marketing intensity (Discover, American Express and Capital One) were among the 6 banks that did generate y/y revenue growth.

How Did U.S. Credit Card Issuers Perform in 4Q12?

Over the past week, leading U.S. credit card issuers have been publishing their 4Q12 and full-year 2012 results.  After we reviewed these financials, we detected the following trends, which are largely consistent with our recent blog on top credit card trends for 2013.

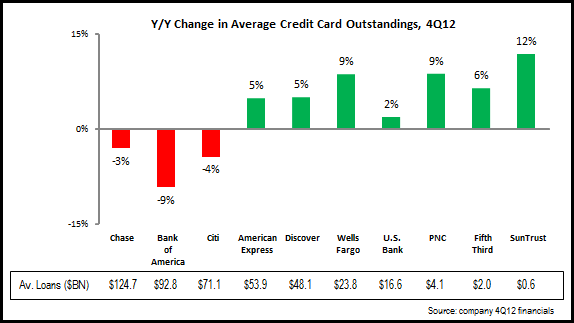
  • Outstandings: The top three issuers continue to report y/y declines in average outstandings, while traditional monolines and regional banks are driving growth. Both Wells Fargo and regional banks focus on cross-selling credit cards to their existing customer base. Wells Fargo reported that credit card penetration of retail banking households rose from 27% in 1Q11 to 33% to 4Q12. Bank of America indicated in its 4Q12 earnings call that it would be focusing on marketing credit cards through the franchise.

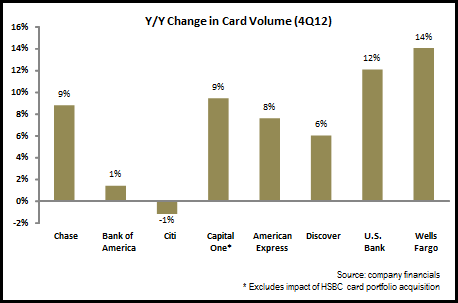
  • Volume: Most leading issuers reported strong y/y growth in volume in 4Q12. However, there is evidence that this growth rate is slowing down. American Express‘ 8% y/y growth in 4Q12 was down from 12% in 1Q12. And during the same period, Chase y/y volume growth fell from 12% to 9%.

  • Charge-off and delinquency rates: Charge-off and delinquency rates continue to trend downwards. Of the 11 issuers studied by EMI,
    • Only Capital One reported a y/y rise in its charge-off rate, and this was due to the acquisition of the HSBC card portfolio.
    • 6 of the 11 reported linked-quarter declines in the charge-off rate. 9 of the 11 have rates below 4%, with two issuers (American Express and Discover) reporting 4Q12 charge-off rates of below 3%. Even Bank of America (which is one of the two issuers with a rate above 4%) reported that its charge-off rate is at its lowest level since 2006. In many cases, charge-off rates are now below historic norms, which points to a fundamental change in consumer attitudes to carrying credit card debt.
    • Delinquency rates also declined y/y, although some issuers did reported linked-quarter increases, driven perhaps by both seasonality, as well as some upward movement as issuers start to pursue loan growth.