As it enters 2013, the credit card sector is looking to continue its slow-but-steady recovery following the financial crisis in 2008-09. The following are a series of industry trends that we expect to see over the next 12 months:
- Outstandings growth, but not for top three issuers. Economic recovery and returning consumer confidence should result in consumers increasing their demand for credit. However, the lingering scars from the financial crisis for both banks and consumers will temper this demand. The top three credit card issuers (Chase, Bank of America and Citi) have scaled back their portfolios dramatically in recent years. These issuers claim that this period of retrenchment is coming to an end, but they are highly unlikely to grow their portfolios significantly in 2013. Instead, outstandings growth will come from issuers like:
- Discover: recently reported 6% y/y growth in outstandings and plans to continue to push lending growth
- Wells Fargo: grew average outstandings 9% y/y in 4Q12, as it continues to grow credit card penetration of its retail banking households (from 27% in 1Q11 to 33% in 4Q12)
- Other regional banks, such as SunTrust, Fifth Third and PNC: who all reported strong y/y outstandings growth in 3Q12 (albeit from relatively low bases), and who (like Wells Fargo) are focused on cross-selling credit cards to existing customers
- Push for loan growth to lead to (some) price competition. In recent years, credit card APRs have been relatively high. Even as competition returned to the affluent card market in 2011 and 2012, there was little or no evidence of APRs moving downwards, with issuers competing instead with bonus points and tiered rewards programs. 2013 may bring some downward pressure on APRs, but issuers will continue to focus on both bonus offers and low introductory rates on purchases and/or balance transfers.
- Lower rate of volume growth. Over the past two years, in the absence of loan growth, issuers have been focusing on growing volume, but there are recent signs that the rate of growth is slowing down. American Express recently announced 8% volume growth in 4Q12, down from 11% in 4Q11 and 15% in 4Q10. Issuers will continue to target volume growth in 2013, but will be looking for volume and loan growth to be more in synch than in recent years.
- Return of revenue growth. With the expected return to some outstandings growth, net interest income should grow significantly in 2013, in particular with interest expense remaining low. Noninterest income will benefit from continued volume growth, but this will be partially offset by many issuers pulling back on marketing payment protection products, which featured prominently in a number of issuer settlements in the past year.
- Charge-offs and delinquency rates to return to a more “normalized” pattern. For many leading issuers, charge-off rates are below historic levels. As issuers begin to target outstandings growth, they will be willing to accept small increases in the charge-off rate. Some issuers are reporting q/q growth in delinquency rates, indicating a return to seasonal patterns that have been largely absent in recent years.
- Pressure to reduce rewards program costs. Issuers’ desire to grow purchase volume among more affluent cardholders in recent years has led to a significant focus on their rewards programs, with the development of tiered rewards, as well as aggressively positioned bonus offers. There are a number of factors that may lead issuers to scale back these rewards-based offers in 2013, including:
- The continuing need to control costs;
- The desire for a more even balance between outstandings and volume growth; and
- The opportunity to develop more merchant-funded offers, in particular as merchants seek to capture consumer spend as it moves to online channels.
- Growth of personalized offers. Advances in data analytics create opportunities for issuers to develop targeted offers based on cardholder demographics, preferences and spending behavior. In addition, the emergence of mobile payments creates the potential to incorporate customer location into offer targeting.
- Emergence of mobile payments. Both mobile wallets and mobile payments have garnered a lot of attention over the past year, although there is a long way to go before they properly emerge as accepted payment methods. However, in 2013, there will be a number of critical steps taken in the continued evolution of mobile payments, including:
- Launch of more mobile devices with more payment capabilities
- Continued growth of mobile person-to-person payments and mobile Internet shopping
- Deployment of more merchant terminals capable of accepting mobile transactions
- Progress towards national rollout by Isis and Google Wallet consortia
- Testing of standalone mobile payments apps by issuers (last week, U.S. Bank announced an iPhone payments pilot for new FlexPerks Travel Rewards Visa Signature cardholders)
- Fundamental shift in credit card positioning. Prior to the financial crisis, credit cards were perceived by consumers (and positioned by issuers) as an easy way to access credit. In recent years, as consumers cut card debt but continued to grow purchase volume, they have developed a more balanced perception of the credit card as both an efficient payments tool and flexible source of credit.
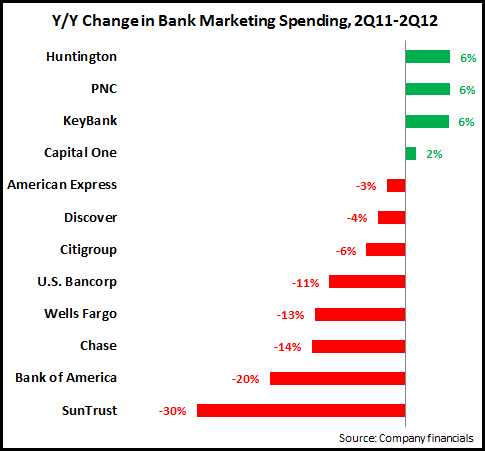
- Focus on nontraditional sales and service channels. Issuers will direct more of their marketing budgets to nontraditional customer acquisition channels, such as online and branch, which also have much lower cost-per-acquisition than direct mail. In addition, issuers will continue to develop new service functionality for both online and mobile channels.
