Card Volume Growth Slows in 2Q12

EMI Strategic Marketing, Inc. analyzed U.S. card volume data from the latest quarterly financials for the four main card networks (Visa, MasterCard, American Express and Discover).  Our analysis reveals that:

  • Year-over-year (y/y) growth in total U.S. card (credit and debit) volume fell from a relatively robust 9% in 1Q12 to only 3% in 2Q12.  The growth decline was largely due to a 1% fall in Visa card volume.  The other three networks each grew volume 9% y/y, but for both MasterCard and American Express, this represented a lower growth rate than in the previous quarter.  Only Discover accelerated its volume growth rate between 1Q12 and 2Q12.
  • For the four networks, U.S. credit card volume rose 7% y/y, down from 10% in 1Q12.  Each of the networks had lower growth rates in 2Q12 compared to 1Q12.  American Express and Visa both had 9% increases, compared to 4% for MasterCard and Discover.  Recently, issuers have been pushing credit card volume growth through tiered rewards and bonus offers, so the decline in growth will be a concern for the card networks.  However, the growth rate remains well above consumer spending growth levels, so credit card continues to take payments share from other payments methods like cash and checks.
  • U.S. debit card volume was flat y/y, significantly down from an 8% y/y rise in 1Q12.  While MasterCard (+15%) and Discover (PULSE Network volume up 14%) both reported strong growth, Visa’s U.S. debit card volume fell 7%, which it attributed to regulatory impacts.  Visa reported in its 2Q12 earnings conference call that the most recent quarter represented a trough for debit volume and it is experiencing stronger performance in the current quarter.
Customers reducing branch usage, but some banks growing branches

Many recent surveys have pointed to customers’ reduced branch usage for everyday banking, as they embrace Internet and mobile banking. Many of the leading banks have reported very strong year-over-year growth in mobile banking active users in 2Q12, including Bank of America (+35%, to almost 10.3 million), Chase (+38% to just over 9 million), and Wells Fargo (+ 38%, to 8.3 million).  At the same time, many banks are implementing aggressive cost savings programs.

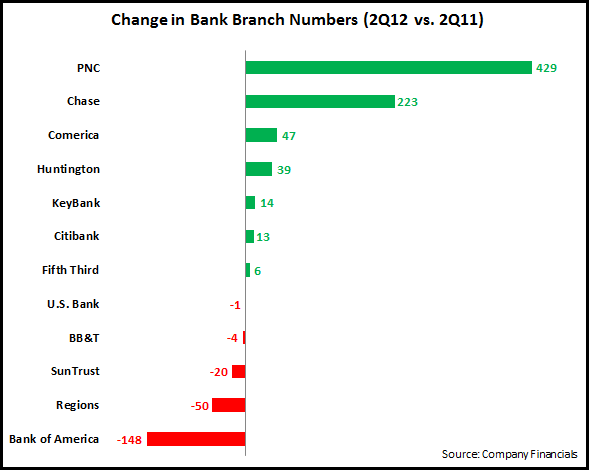
Based on this, one would expect banks to significantly cut back on their branch investment.  FDIC data bears this out, with total U.S. bank branch numbers falling by more than 500 in the year to end-March 2012.  However, the following chart reveals that this trend is not universal, with many leading banks increasing branch numbers over the past year.

While some banks (such as Chase) have grown their networks organically, the increase in branch numbers for most of the other banks listed above was a result of branch/bank acquisitions.

  • PNC grew its branch network following the acquisition of RBC Bank, as well as the purchasing of branches from Flagstar Bank.
  • Chase grew its branch network in growth markets like California and Florida.  However, it has scaled back ambitious plans to grow its network further in the coming years.  Chase has also radically expanded its Private Client locations, from 16 in 2Q11 to 738 in 2Q12.
  • KeyBank’s net increase of 14 branches was due to the acquisition of 37 branches in upstate New York, partially offset by branch closures.  The bank has reported that branch rationalization is one of the central elements of its new efficiency initiative, and it plans to cut 5% of its branches in the next 18 months.

Factors that impact bank branch numbers include:

  • M&A activity (highlighted in the examples above)
  • Strategic decisions to increase/reduce presence in specific markets (e.g., grow branch numbers in targeted markets, or reduce branches in other markets where the bank’s branch presence is below a minimum threshold)
  • Ability of specific branches to meet performance goals (e.g., growth, profitability)
  • Competitive activity

Though surveys indicate that branch usage is declining, a majority of consumers and small businesses still value branches, as they want a multi-channel bank relationship (encompassing physical and virtual channels).  This is leading banks to change branch design and staffing models in order to reposition branches to provide a broader role for the bank, in areas like selling, relationship development, product testing, and branding. (See our recent blog on the changing role of the branch.)

Commercial loan growth momentum continues at leading U.S. banks

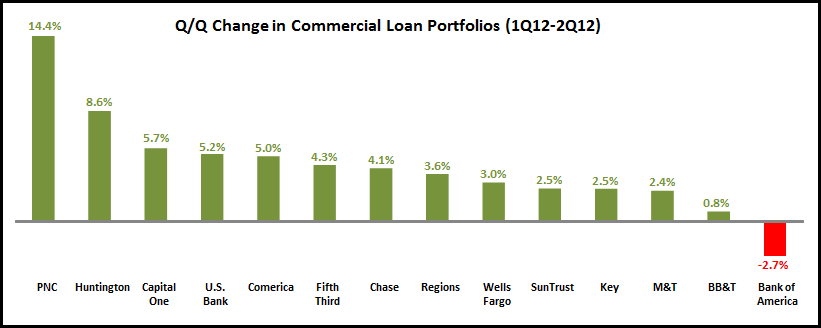
In spite of the continued economic uncertainty, U.S. banks continue to enjoy strong growth in commercial lending. A study of the 2Q12 financial results of 14 leading U.S. banks revealed that 11 grew average commercial loans by double-digit rates. In addition, 11 banks had higher year-over-year growth rates in 2Q12 than in 1Q12.

13 of the 14 banks reported growth in commercial loan portfolios between 1Q12 and 2Q12.

Looking at specific banks:

  • Commercial loan growth was led by PNC, although it should be recognized that PNC completed the acquisition of RBC Bank in 1Q12, which significantly skews the data.  PNC recorded above-average growth rates for financial services and health care loan portfolios.
  • U.S. Bank had the second-largest y/y growth rate, at 24%, led by a 52% rise in its specialized industries portfolio.
  • Comerica increased its average commercial loan portfolio 20% y/y, driven by a 46% rise in its specialty lending portfolio. (Over the past year, Comerica grew its energy loan portfolio by 68% and its tech and life sciences portfolio by 36%.)
  • KeyBank’s average commercial, financial and agricultural loan portfolio grew 19% y/y. KeyBank reported that its commercial loan utilization rate has been increasing in recent quarters, from 43.4% in 2Q11 and 46.9% in 1Q12 to 47.3% in 2Q12.
  • Chase grew commercial banking average loans 16% y/y, driven by a 42% rise in its corporate client banking loan portfolio (which covers clients with $500 million to $2 billion in annual revenue).
  • Bank of America was the only bank to report a quarterly decline in its average commercial loan portfolio (-2.7%). In addition, it had the second-lowest y/y growth rate (of 6.1%).

Most of the banks are reported improvements in commercial loan charge-off rates.  However, yields on commercial loans continue to fall. All 12 of the banks reporting commercial loan yield data had y/y declines, but it’s important to note that 4 of the 12 (PNC, Wells Fargo, BB&T and M&T) reported an increase in commercial loan yields between 1Q12 and 2Q12.