5 channel takeaways from 1Q15 U.S. bank financials

The quarterly reports of the leading U.S. banks revealed a number of important channel trends:

  1. Mobile banking is continuing its strong growth.  Three of the leading U.S. banks provided quarterly updates on active mobile banking users, and each reported double-digit y/y growth in 1Q15: Chase +22% to 20.0 million; Bank of America +13% to 16.9 million; and Wells Fargo +19% to 14.9 million.  According to eMarketer, more than half of adult mobile phone users are expected to use mobile banking in 2015.
  2. Consumers are transitioning to self-service channels for a growing range of transactions.  PNC reported that 50% of its consumer customers used non-branch channels for a majority of their banking transactions in the first quarter of 2015, up 7 percentage points y/y.  PNC also reported that the non-branch (ATM and mobile) channel share of deposit transactions doubled from 20% in 1Q13 to 40% in 1Q15.
  3. Many banks are slowly shrinking their branch networks.  Leading banks who reported significant branch reductions in the most recent quarter include: Citibank (down 61 during the quarter, as its pursued its strategy of consolidating its presence in 7 U.S. markets), PNC (-37 branches), Regions (-33) and Chase (-31 ).  Although Bank of America has closed more than 800 branches over the past three years, the net branch decline fell to 20 in the first quarter of 2015.
  4. Some banks are growing branch numbers…and in-branch sales staff.  In spite of the general perception that the branch channel is in the process of terminal decline, some banks are in fact acquiring or opening branches in order to capture growth opportunities.  Huntington Bank reported the addition of 43 new in-store branches in Michigan.  And even though Bank of America reduced branch numbers by 260 over the past year, it grew sales specialists by 5%.
  5. Banks remain committed to the branch network as consumers use multiple banking channels.  While electronic self-service channels have a dominant share of everyday banking transactions, branches still play a key role in areas like new account generation, customer relationship management (including cross-sell), and branding.  Wells Fargo claims that its most loyal customers are not those who have the most products, but rather those who use the most channels most often.  It reported that mobile banking sessions rose 38% in 2014, while branch visits remained steady.

5 takeaways from leading credit card issuer 1Q15 financials

An analysis by EMI of the latest quarterly financials from the leading U.S. credit card issuers revealed the following trends:

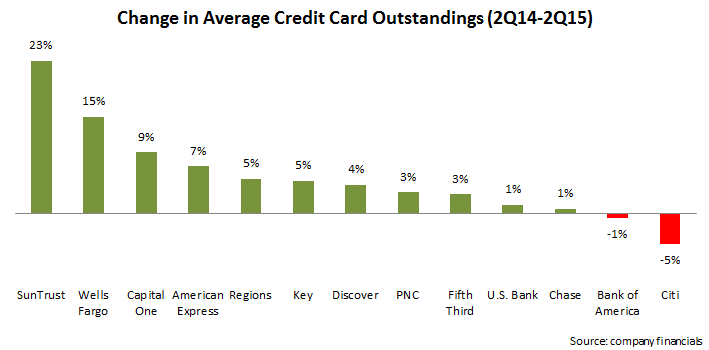
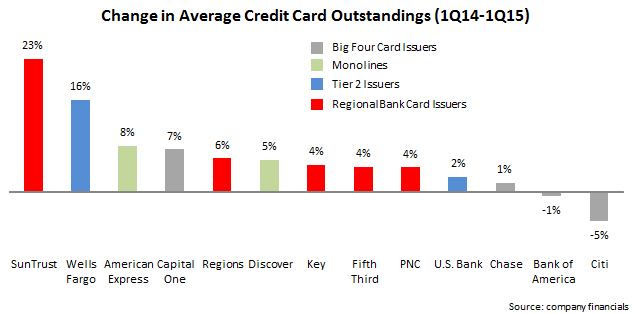
  • Growth in average outstandings.  Of the 13 leading issuers studied, 11 reported y/y increases in average outstandings.
    • The two exceptions were Bank of America and Citi, two of the top four issuers and this continues a longstanding pattern
    • Capital One—another top four issuer— reported a strong growth rate of 7%, driven by origination programs and line increases.  However, it should be noted that Capital One retains some of the credit card monoline heritage, with card loans accounting for 40% of its total loan book.
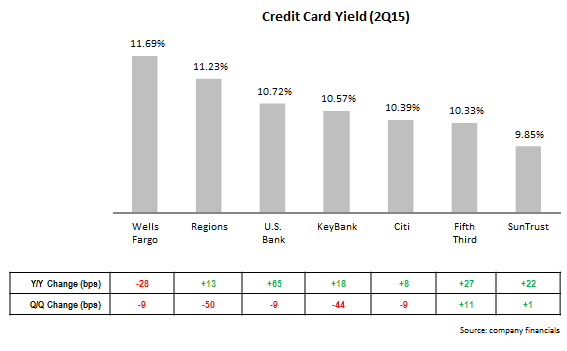
    • Strongest growth was reported by SunTrust, although it should be noted that this comes from a low base, with average card loans accounting for just 0.7% of SunTrust’s total loans, a percentage that is significantly lower than its regional bank peers.  It is also worth noting that SunTrust’s credit card yield was below 10% in 1Q15, lower than regional bank peers like Fifth Third (10.22%) and Regions (11.73%), as well as larger issuers like U.S. Bank (10.81%) and Wells Fargo (11.78%).
    • Wells Fargo also reported very strong y/y loan growth of 16%, although this included the acquisition of the Dillard’s private-label portfolio.  Its credit card penetration of retail bank households rose nearly four percentage points y/y to 41.8%, although the rise in penetration slowed sharply in the most recent quarter, increasing just 28 percentage points.

average_card_loans_1Q15

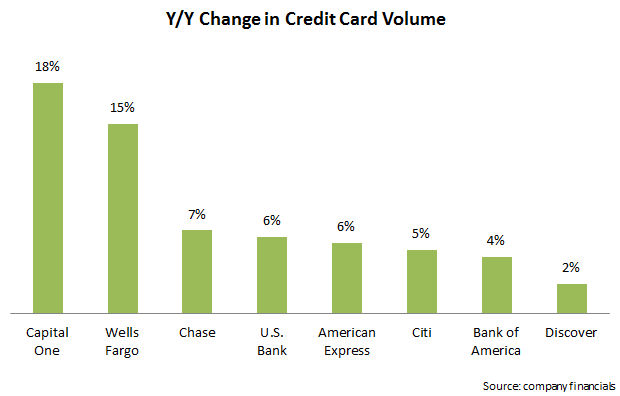
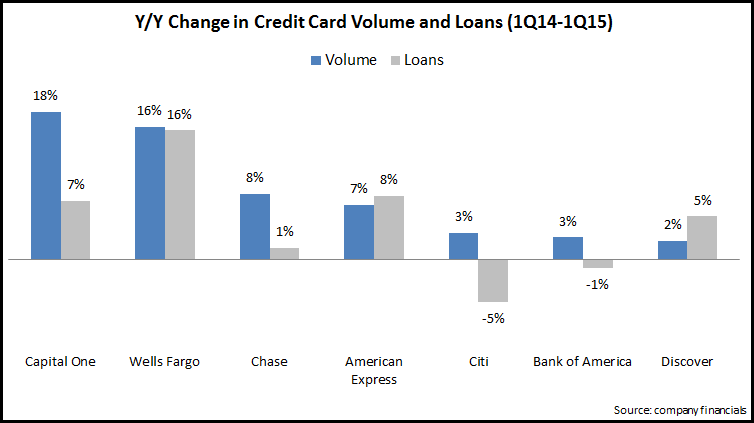
  • Outstandings starting to come into line with volume.  Since the 2008 financial crisis, the card industry has focused more on increasing cardholder purchase volume rather than outstandings.  As you see in the following chart, volume growth continues to outstrip outstandings growth.
    • Of the 7 issuers below reporting y/y changes in both volume and outstandings, only American Express and Discover reported higher growth rates for outstandings than volume.
    • Ideally, issuers would like outstandings and volume to grow at similar rates; American Express and Wells Fargo were most effective at achieving this in the most recent quarter.
    • Some issuers reported that lower gas prices had a depressing effect on volume growth.

card_volume_card_growth_1Q14-1Q15

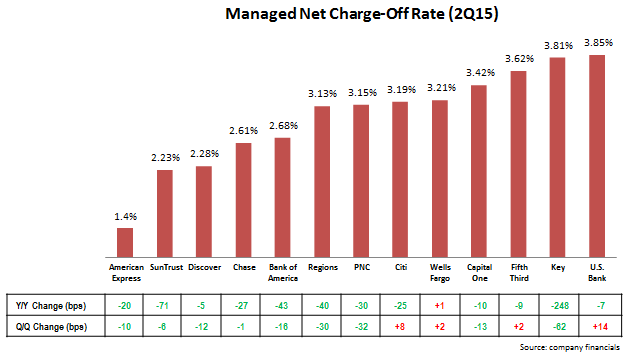
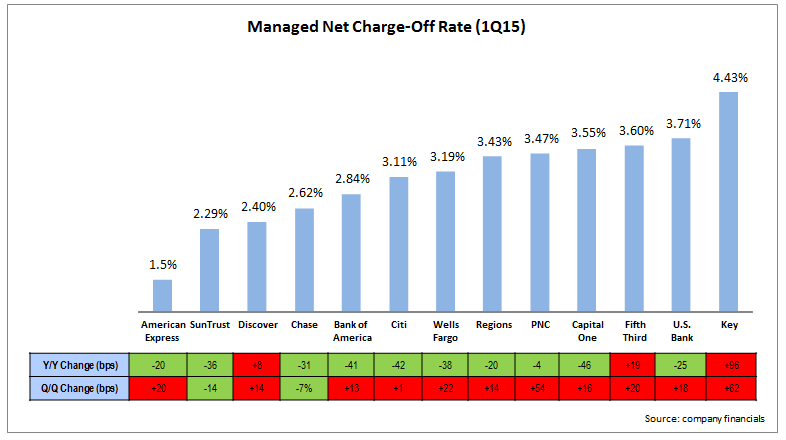
  • Charge-offs remain at historic lows. 12 of 13 issuers reported credit card net charge-off rates below 4% in 1Q15, with 5 issuers below 3%.  In addition, 10 of the 13 issuers reported y/y declines in charge-off rates.  Although most issuers reported growth in charge-off rates between 4Q14 and 1Q15, this is a normal seasonal pattern, and there is little sign of significant upward movement in charge-off rates.  Some issuers are revising downward their future charge-off rate expectations: Capital One reported that its rate may fall to the low 3% range in 3Q15 (although it does expect rates to rise in 4Q15 and 2016). And Chase expects that its full-year 2015 net charge-off rate will be less than 2.5%.

credit_card_charge-off_rates_1Q15

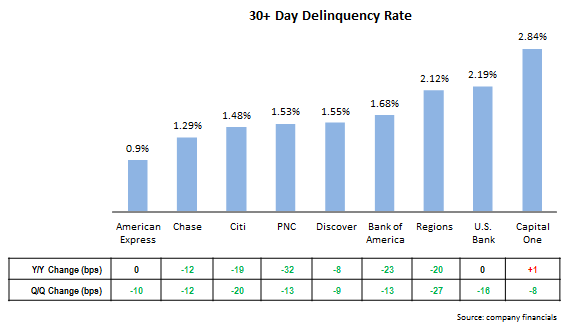
  • Delinquency rates continue to fall.  Of the 8 issuers who reported 30+ day delinquency rates, all reported y/y declines.  This indicates that there is little upward pressure on charge-off rates, as delinquencies tend to be leading indicators of future charge-offs.
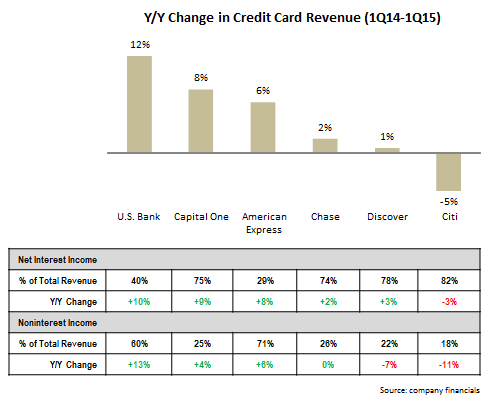
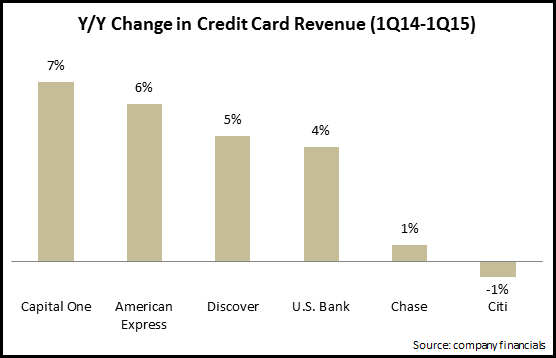
  • Signs of revenue growth. in recent years, issuers have reported low/no revenue growth and have instead generated profits from low provisions for loan losses.  As issuers have now begun to target outstandings growth, revenues have started to increase.  Of the 6 leading issuers providing credit card revenue data in 1Q15, 5 reported y/y growth.  In addition, 4 of these 5 issuers reported growth in both net interest and noninterest income.

credit_card_revenue_1Q14-1Q15

Banks Grew Marketing Budgets and Marketing Ratios Modestly in 2014

EMI analysis of recently-published FDIC data on 2014 marketing spending for 17 leading banks found that banks are beginning to grow their marketing budgets in order to drive revenue growth in a growing economy.  The scale of the increase was relatively modest, a trend that we expect to continue in 2015, as banks look to marry their desire for revenue generation with a continued need to exercise a tight rein on costs.

Specific findings from our analysis:

  • Total marketing spending for these 17 banks rose 4% between 2013 and 2014. 10 of the 17 banks increased their marketing budgets, 6 cut their budgets, while SunTrust’s marketing expenditure was unchanged.
  • Net revenues for the 17 banks fell 2%; as a result, their marketing-to-revenue ratios rose by 16 basis points to 2.84%.
  • Chase had by far the largest marketing budget at nearly $2.8 billion, up 2% from 2013.  Four other leading banks (American Express, Citigroup, Capital One and Bank of America) had marketing budgets of more than $1 billion.
  • Of the 10 banks that grew their marketing budgets in 2014, 5 also showed increased revenues. The 4 banks with the lowest marketing-to-revenue ratios reported revenue declines between 2013 and 2014.
  • The variation in marketing-to-revenue ratios among these banks is huge.  American Express and Discover are primarily credit card issuers and lack branch networks; they tend to have marketing-to-revenue ratios of 8-10%, in line with fast-moving consumer goods (FMCG) companies.  National bank marketing ratios tend to be around 3%, while regional bank ratios are generally between 1% and 2%.
  • Even within these  bank categories, there are significant variations.  Capital One is a regional bank with a very significant credit card portfolio, so its marketing-to-revenue ratio (6.1%) falls between a monoline and a regional bank.  Wells Fargo trailed its national bank peers in marketing spend.  Although it grew its 2014 marketing budget by 8% to $613 million, its marketing-to-revenue ratio remains below 1%.

bank_marketing_revenue_ratios_2014