FDIC Publishes Detailed Branch Data: Key Takeaways

The FDIC recently published detailed branch and deposit data for different geographic levels for all U.S. banks. EMI’s analysis of this data revealed the following trends:

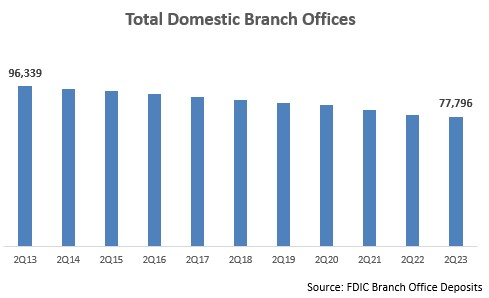
  • There is a continued (but slowing) decline in the number of bank branches. Over the past 10 years, the total number of domestic branches for FDIC-insured institutions declined by almost 24% to fewer than 78,000 branches. This equates to an annual average decline of 2.1%. In 2Q21 and 2Q22, the y/y rate of decline exceeded 3%, but this slowed to 1.7% y/y to the end of June 2023.
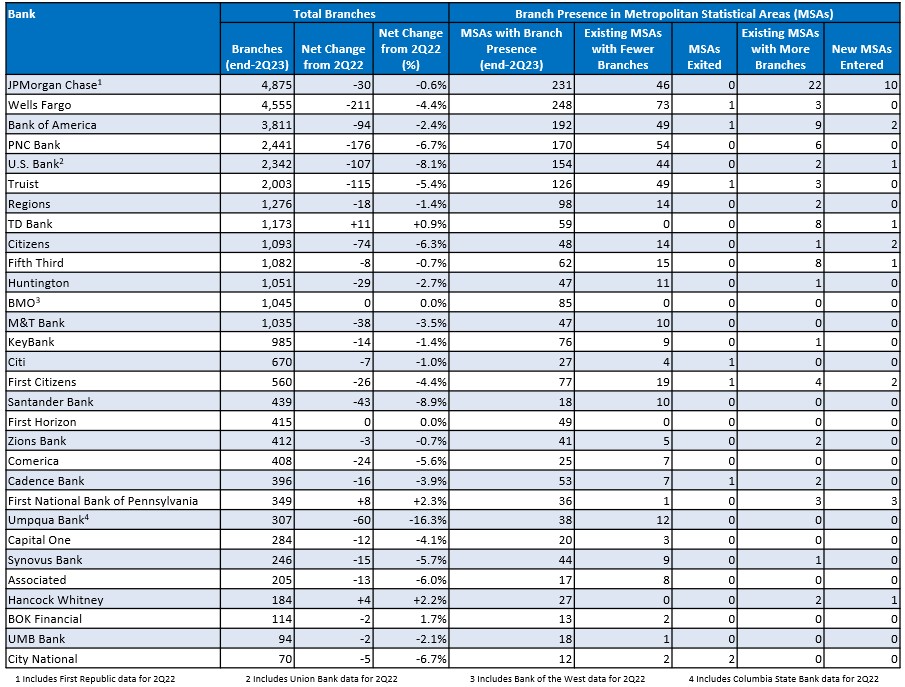
  • Some of the largest banks had the strongest percentage declines in branches. Our detailed analysis of 30 leading banks (see below) found a 3.1% y/y decline in branches (from 35,039 to 33,920) at the end of 2Q23. However four banks with networks of more than 2,000 branches reported declines of more than 4%: Wells Fargo (-4.4%); PNC (-6.7%); Truist (-5.4%) and U.S. Bank (-8.1%). Santander Bank reported the largest percentage decline (-8.9%).
  • Some banks are growing their branch networks. While the overall trend has been for banks to trim their networks, some banks are maintaining or even growing their commitment to this channel. TD Bank grew its network by 11 branches, adding branches in 8 existing markets, as well as opening its first branch in The Villages, FL. Following the collapse of its planned merger with First Horizon earlier this year, TD announced plans to open 150 U.S. branches by 2027 with a focus on Southeast markets.
  • Banks are maintaining their presence in the vast majority of their markets. While banks are reducing branch density in their existing markets, few are completely leaving these markets. Seven of the 30 banks exited a market over the past year, but only one left more than one market: City National Bank closed its branches in both Reno and Carson City, NV.
  • Branch closures were spread across many existing markets. Overall, the 30 banks closed branches in 22% of their existing markets, through several had higher percentages of existing markets impacted by closures, including Santander Bank (56%), Truist (39%) and PNC (32%).
  • Banks concentrated their reductions on markets with the largest branch networks. Banks reduced branch densities in many of their main markets, enabling them to cut costs while maintaining a significant presence. Although more than a third of Wells Fargo’s branch reductions took place in just 8 markets, each of those markets continues to have more than 100 branches.
  • Some banks are opening new branches in existing markets. The 30 banks increased branch numbers in 4% of existing markets, led by TD Bank (increased branch numbers in 14% of their existing markets) and Fifth Third (13%), who are both expanding their presence in key southeastern U.S. markets. JPMorgan Chase increased branch numbers in 22 markets (10% of its existing markets), including Washington (+11 branches), Minneapolis (+9), Kansas City (+7) and St. Louis (+7).
  • J.P. Morgan Chase is leading the way in market expansion. Over the past year, the bank opened branches in 10 new markets, including Buffalo and Virginia Beach (4 new branches in each market). This is part of a longer-term strategy to grow its branch footprint: the bank reported at its 2023 Investor Day that its population coverage rose from c. 60% in 2017 to c. 80% in 2022, with the bank now aiming for 85% population coverage.

Accelerate Commercial Loan Growth Through Vertical Industry Targeting

According to the FDIC’s Quarterly Banking Profile, U.S. commercial and industrial loans rose 4.8% y/y to $2,077 billion at the end of June 2018.  This marks the third consecutive quarter of accelerating y/y growth since reaching a six-year low of 2% at the end of 3Q17.  Evidence from leading banks’ quarterly financials and investor presentations is that this commercial loan growth is often driven by a focus on particular vertical industry sectors.  For example, PNC reported commercial loan growth of 4.5% in the year to the end of 2Q18, driven by financial services (+9%) and retail/wholesale trade (+7%)

Vertical industry targeting provides a range of benefits for these banks:

  • Drives stronger growth in loans to that sector—in particular if that sector has been underserved—which can help push up overall commercial loan growth rates.
  • Provides a point of differentiation from competitors.
  • Enables a bank to leverage synergies between traditional or current bank strengths (such as expertise in certain product or service categories, or proximity to industry clusters) and the financial needs of targeted companies.
  • Creates an opportunity for a bank to expand beyond its traditional retail branch footprint into new geographic markets. Fifth Third recently launched a Financial Institutions Group in New York City.

We recently scanned the commercial banking sections of leading banks’ websites to identify targeted industry sectors, which we have summarized in the following table.  Not surprisingly, most of the banks are targeting large sectors (e.g., healthcare, energy and government).  However, a number of banks also appear to be targeting more niche sectors, such as aging services (SunTrust), the wine industry (Union Bank) and vacation ownership (Capital One).

We recognize that simply listing industries on their websites does not mean that these banks are fully engaged in targeting these sectors.  But if your bank is looking to significant grow clients and assets in particular vertical industry sectors, the following are some key considerations:

  • First step: size the market opportunity (e.g., how many companies from that industry meet your revenue/other target-size criteria and are located within your traditional retail footprint and nationally).  It also important to identify industry clusters.
  • Use primary and secondary research to identify company characteristics, financial needs and the decision-making process.  A key source of primary research should be your front-line salespeople who may already be selling to these companies in your targeted sectors.  You should then be able to asses the bank’s current ability—in terms of product suites, number and quality of dedicated personnel, as well as marketing and sales support assets—to effectively serve these segments.
  • Conduct competitive intelligence to study other financial providers targeting the same segments.  Identify you key strengths and limitations relative to these competitors.
  • Create and deploy dedicated industry teams.  If possible, locate your teams in markets where targeted companies are concentrated.  Staff the teams with industry experts and support them with training, industry collateral and other sales support tools.
  • Build awareness and engagement through targeted marketing investment, with a focus on particular in industry-specific marketing media and events.
  • Further engagement with prospects through industry-specific thought leadership, using a mix of formats and media, such as articles (published in your own content portals or in vertical industry media), blog posts, social media channels, surveys, reports, and client success stories.

Issuers Report Strong Credit Card Loan Growth Across FICO Segments in 2017

According to the latest FDIC Quarterly Banking Profile, U.S. credit card loan growth accelerated in 4Q17, rising 8.2% to $865 billion.

Given the strong overall growth in credit card receivables, are issuers focusing their growth ambitions on particular FICO Score categories? To address this question, EMI analyzed 10K SEC filings for leading credit card issuers.  Overall, we found that issuers reported strong credit card loan growth across their FICO Score segments. We also studied trends in different issuer categories.

  • In the aftermath of the Financial Crisis, the three leading issuersChase, Bank of America and Citi—focused attention away from near-prime and sub-prime segments and towards superprime consumers.  This led to significant declines in both outstandings and charge-off rates.  More recently, as economic growth and consumer confidence returned, these issuers have refocused on loan growth and are once again targeting lower FICO Score segments.  This is seen in the chart below that shows changes in outstandings by FICO Score segment between end-2016 and end-2017.  As these issuers are pursuing loan growth, their credit card net charge-off rates have also increased (+26 bps y/y at Bank of America, +30 bps to at Chase, +59 bps at Citi-Branded Cards North America).  However, charge-off rates remained below 3% for each of these issuers in 4Q17, and issuers should continue to focus on loan growth while charge-off rates continue at these low levels.

  • Second-tier national credit card issuers—Discover, Capital One and Synchrony—reported relatively strong growth, but with different FICO Score segment trends.  Discover reported 9% y/y growth, with no y/y change in share of outstandings for the <660 and 600+ segments.  Capital One had a similar overall growth rate (8%), but this was driven in part by the acquisition of the Cabela’s card portfolio, which boosted the >660 FICO segment’s share of outstandings.  It is also worth noting that the <660 FICO segment accounted for 34% of Capital One’s credit card portfolio at the end of 2017, compared to 25% of Synchrony’s portfolio, and 18% at Discover.

  • Regional credit card issuers present a mixed picture when it comes to the FICO Score segment composition of their credit card portfolios. This is driven by a number of factors, including a large variation in portfolio sizes, as well as their credit card underwriting standards.  Most issuers report growth across their portfolios, with strong growth rates in the low FICO Score segments.  Fifth Third reported very strong growth for its <660 segment, but this segment only accounts for 3% of its portfolio.  Regions’ 20% growth in its <620 FICO segment was driven by its launch of a credit secured card in July 2017.

Finally, as most issuers reported strong growth in their credit card portfolios in 2017, charge-off rates are also on the rise, growing 45 bps y/y to 3.61% at the end of 2017.  While the overall charge-off rate has risen from a low of 2.19% in 3Q15, it is down both from post-recessionary highs of 13.13% in 1Q10, and even the 4% levels in 2007, prior to the Financial Crisis.  With charge-off rates still below 4%, the leading issuers continue to be comfortable with promoting credit card loan growth.