Credit Card Issuers Continue to Pursue Spend-Centric Model

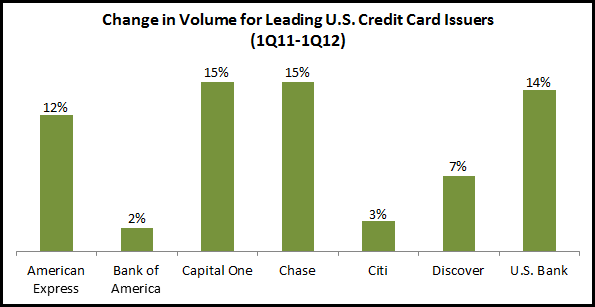
First quarter 2012 results of the leading U.S. credit card issuers reveal that they are continuing to drive spending growth by cardholders. Four of the seven leading issuers reported double-digit year-on-year growth rates, led by Chase and Capital One at 15%, followed by U.S. Bank at 14% and American Express at 12% (American Express also reported that small business card volume rose 16% y/y, its highest growth rate since before the financial crisis.  In contrast, Bank of America and Citi had anemic – albeit positive – growth rates.

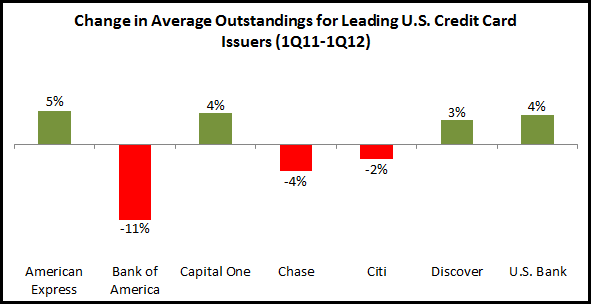
The situation with regard to lending growth is more mixed. With the return to economic growth, and the significant improvement in credit quality, issuers have been looking to increase outstandings. However, consumers still bear the scars of the financial crisis and remain reluctant to increase their card borrowing. In addition, many issuers have not yet significantly relaxed the stricter underwriting standards that came into place in 2008 and 2009. The three largest issuers (in terms of outstandings) all reported y/y declines, with Bank of America’s average loans falling 11%. Bank of America’s average U.S. credit card outstandings have declined almost 22% over the past two years, and fell below $100 billion in the most recent quarter.  (It should be noted that this decline is partly attributable to card portfolio sales, with the bank selling portfolios over the past year to Regions, Sovereign and Barclaycard.)  Bank of America and Citi were the two issuers with declines in both volumes and outstandings. Chase also reported a y/y decline in average outstandings, but this was due to the sale of the Kohl’s private label portfolio in the first quarter of 2011.

So, at first viewing, we see some credit card portfolio retrenchment among those banks like Bank of America and Citi that were hardest hit by the financial crisis, while other leading issuers are now growing their portfolios. However, at closer inspection, Bank of America and Citi are also positioning themselves for future card growth. Citi had credit card account growth for the fourth consecutive quarter. And Bank of America reported that new accounts in 1Q12 were up 19% y/y.

In addition, it is notable that Bank of America is changing the composition of its card portfolio by selling off some private-label card portfolios and changing how cards are originated. (It reported that half of the 800,000 cards originated in the first quarter came through its branch channel.)

FICO distribution of card issuer portfolios shows focus on prime segment

Over the past year, many leading U.S. credit card issuers have increased their focus on more affluent segments with new cards and offers.  At the same time, these issuers have continued to try to reduce their exposure to consumers with low credit scores. A study of SEC filings for some of these issuers highlights the extent to which these efforts have led to significant shifts in the FICO distribution of their card portfolios.

  • Although Citigroup’soverall U.S. credit card portfolio fell by 5%, its prime portfolio (660+ FICO) rose by 6%, while its subprime portfolio (<620) fell by a whopping 48%.
  • Mirroring Citigroup, Bank of America’ssubprime portfolio fell by more than 40% in 2011.
  • Unlike Citigroup and Bank of America, Chase does not publish outstandings data for different FICO segments, but it did report that its prime (600+ FICO) portfolio’s share of total U.S. credit card outstandings rose from 77.9% at the end of 2010 to 81.4% at the end of 2011.

Many issuers anticipate a return to credit card outstandings growth in 2012. Based on the evidence above, issuers will be focusing their efforts on the prime segment, with new products, bonus offers, attractive introductory offers, and perhaps even lower APRs. With recovery in both economic growth and consumer confidence, the decline in near-prime and subprime portfolios should also abate.

FDIC Quarterly Report Shows Upsurge in Bank Lending

The FDIC’s quarterly banking report shows signs of strong lending growth.  As increased lending is a sign of growing economic confidence, this report is a positive indicator both for the industry, which has been struggling for revenue growth in recent quarters, as well as for the economy in general.

According to the FDIC:

  • Total loans and leases rose 1% year-over-year (y/y) and 2% quarter-over-quarter (q/q) to $7.5 billion at the end of 4Q11. The charge-off rate was 1.37% in 4Q11, down 93 bps y/y and 9 bps q/q. The charge-off rate is now at its lowest level since the second quarter of 2008, just prior to the full onset of the financial crisis.
  • Overall loan growth was driven by strong growth in commercial and industrial (C&I) lending. End-of-period C&I loans rose by 14% between 4Q10 and 4Q11, and by 5% between 3Q11 and 4Q11. The C&I net charge-off rate fell 76 bps y/y and by 5 bps q/q, to 0.78% in 4Q11.
  • Drilling down into C&I lending, small business lending (defined as C&I loans of less than $1 million) fell 3% y/y, but rose 1% q/q, reflecting other recent indicators that banks are returning to small business lending. And it is notable that growth in small business lending is most evident among the largest banks.

So following a number of years of retrenchment, how well prepared are banks to ramp up their lending activity? To position themselves to benefit from an overall resurgence in lending, individual banks need to:

  • Undertake a comprehensive assessment of their capabilities and processes, covering vital areas such as product portfolios; positioning and marketing activities, sales structure and support, as well as customer communications
  • Benchmark bank performance against competitive best practices
  • Identify operational areas that are under-performing, and
  • Implement initiatives to quickly correct these deficiencies