U.S. C&I Loan Trends in Latest FDIC Data

A recent EMI blog post highlighted commercial loan portfolio trends in the third quarter 2012 financial results for leading U.S. banks.  Building on this, EMI analyzed recently-published FDIC data to gain insights into commercial loan portfolio trends for all U.S. banks:

  • Larger banks are generating stronger C&I loan growth than smaller banks.  According to the FDIC, total C&I loans rose 15% between end-3Q11 and end-3Q12.  Banks with more than $1 billion in assets increased C&I loans by 16%.  Banks with less than $1 billion in assets grew C&I loans by only 3% (banks with less than $100MM in assets actually reported a 1% decline in C&I loans).

  • Larger banks have a higher C&I loan concentration. C&I loans account for 20% of total U.S. bank net loans.  Not surprisingly, C&I loan concentrations are higher in banks with more than $1 billion in assets (21%) than in banks with less than $1 billion in assets (13%).
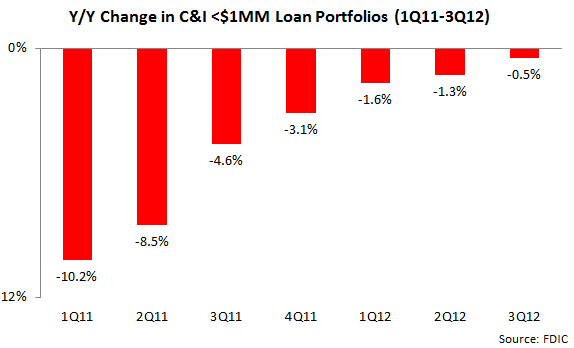
  • Declines in small business loan portfolios are starting to bottom out. Small business loan portfolios (defined as C&I loans of less than $1 million) fell by 0.5% in the year to end-3Q12.  However, the rate of decline has been slowing, as originations/renewals start to catch up with charge-offs/expirations.

Commercial Lending Trends in U.S. Banks’ 3Q12 financials

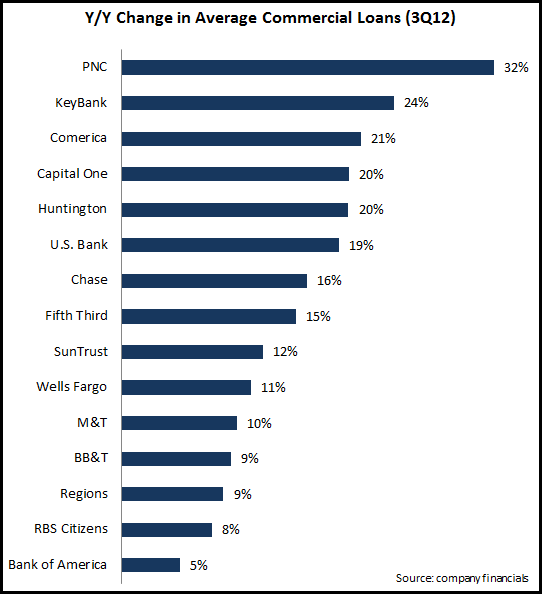
A noteworthy trend among large U.S. banks’ 3Q11 financials has been the significant rise in commercial lending. This continues a trend that has been evident in recent quarters. Of course, the current strong growth follows significant declines in commercial lending in 2008 and 2009 in the wake of the financial crisis.

Some of these banks have boosted overall commercial loan growth rates by targeting specific industry sectors. Comerica generated overall commercial loan growth of 21%, but grew its energy loan portfolio by 62% and its tech and life sciences portfolio by 36%. Other banks are following the industry targeting trend. Huntington recently launched a new energy lending initiative, and Associated Bank established a Healthcare Industry Banking Group.

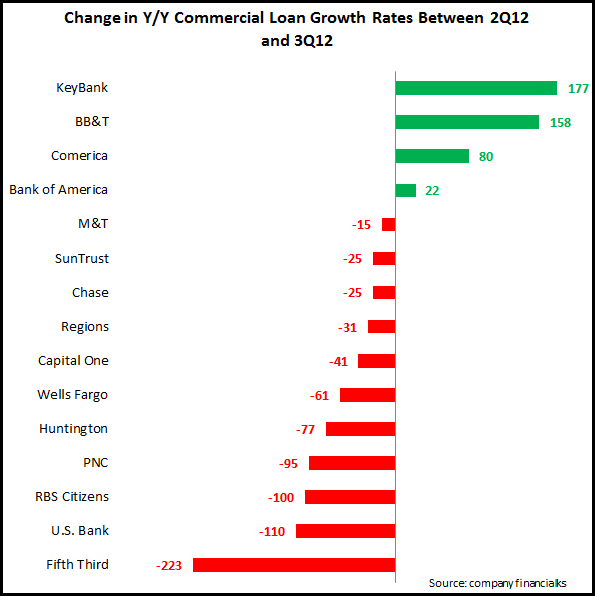
It is notable, however, that uncertainty regarding the Presidential election and the looming fiscal cliff led to an overall 22 bps decline in y/y commercial loan growth rates between 2Q12 and 3Q12 for the 14 banks in our study, from 13.52% to 13.33%.

Although growth rates are robust, loan utilization rates remain relatively low, which can again be attributed to the economic uncertainty as well as many larger companies being flush with cash. The relatively low utilization rates indicate that commercial loans growth could accelerate once again if and when fiscal issues are resolved and economic confidence increases. And some banks are already seeing improved utilization rates:

  • Comerica’s utilization rate was 48.2% in 3Q12, having hit a low of 44.2% in 1Q11.
  • Regions’ utilization rate grew from 39.8% in 4Q10 to 44.4% in 2Q12.

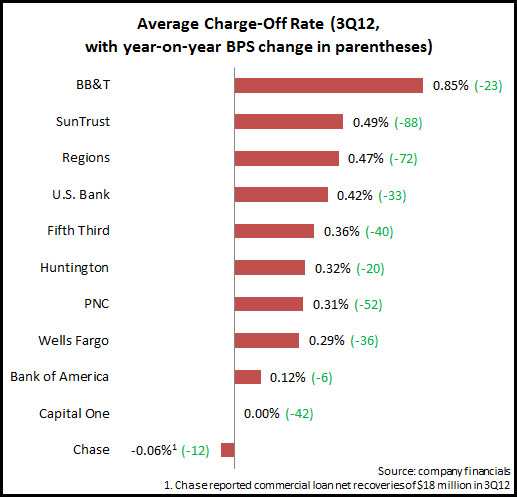
Even as banks grow commercial lending, charge-off rates continue to decline. EMI’s analysis of charge-off data from 11 leading banks found an average commercial loan charge-off rate of 0.25% in 3Q12, down 29 bps year-over-year, and 11 bps from the previous quarter.

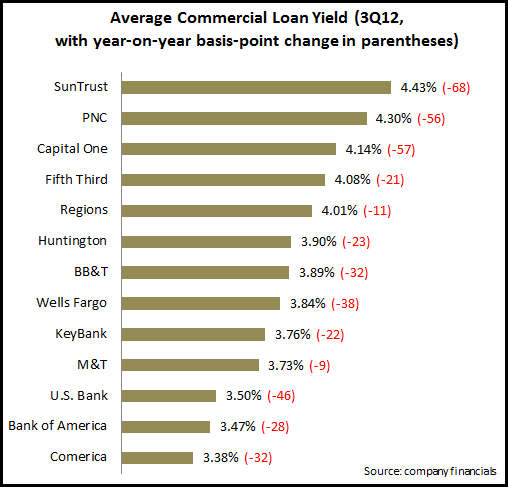
Finally, both low interest rates and increased competition continue to exercise downward pressure on commercial loan yields. Our analysis of yield data from 13 leading U.S. banks found that the average yield in 3Q12 was 3.81%, down 35 bps y/y and 19 bps q/q.

Credit Card Issuers Continue to Target High FICOs

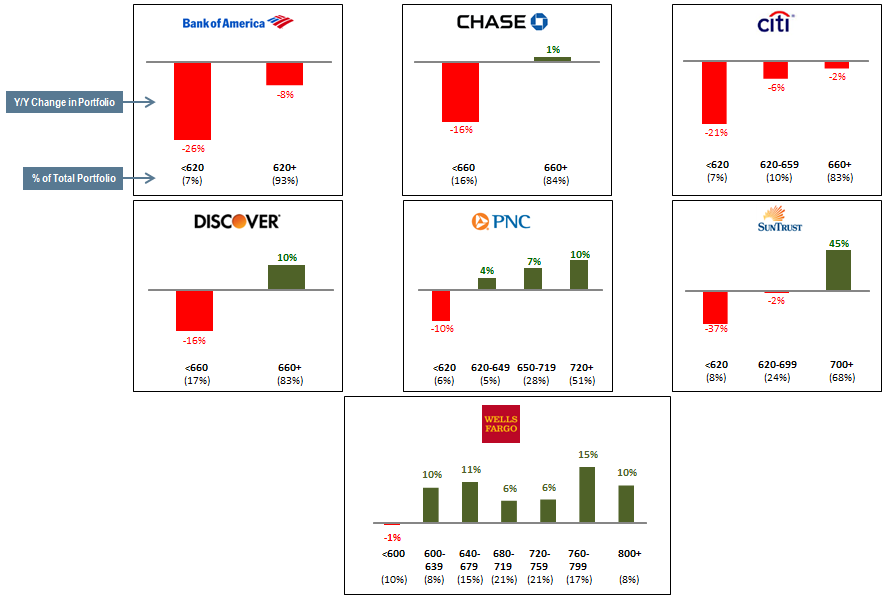
In the wake of the financial crisis, credit card outstandings fell significantly in all segments of the market in reaction to spiraling charge-off rates.  This decline was particularly pronounced in the sub-prime segment.

Over the past two years, the market has stabilized:

  • There have been large decreases in charge-off and delinquency rates (these rates are now at or below historic norms for many issuers)
  • The rate of decline in total outstandings has slowed, with some issuers now reporting loan growth

However, the following charts show that there are significant differences in credit card portfolio growth/decline rates for different FICO credit score segments.  This indicates that the move away from low- and sub-prime issuance, which began in the financial crisis, has persisted even though the crisis has largely passed.  This is driven by a number of factors, include consumer reluctance to borrow and CARD Act restrictions on repricing.

The changes in the issuer portfolios points to a fundamental change in the payments market.  Issuers are increasingly focused credit card product development and marketing on the prime and super-prime segments, while using secured and prepaid cards to meet the needs of the near- and sub-prime segments.