Banks bucking slowdown in commercial loan growth through industry targeting

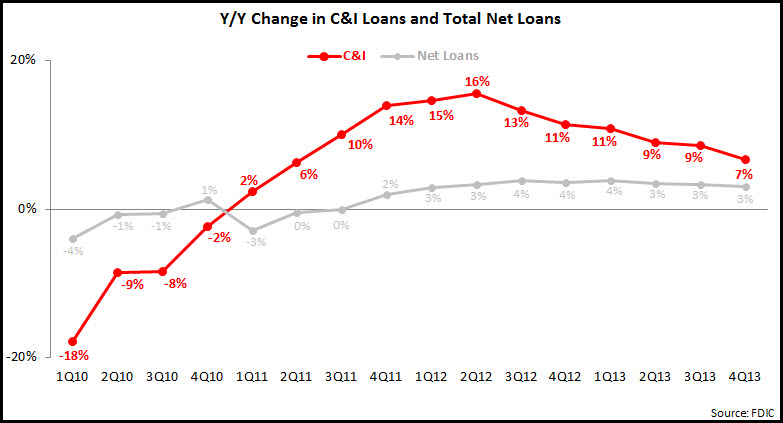
The growth rate in U.S. C&I loan portfolios has been decelerating in recent quarters (see EMI’s March 4th blog post).  To buck this trend, banks are trying to identify and target vertical industries with significant growth potential and/or that have not been effectively targeted in the past.

The following charts show some industries where banks reported strong loan growth in 2013.
(The figures in parentheses show the index of industry-specific growth to overall commercial loan growth, with average growth = 100.  For example, Fifth Third’s retail industry loan portfolio grew 26% between end-2012 and end-2013, which is almost five times higher than Fifth Third’s overall commercial loan growth of 5.4%.)

The following are some quick tips for banks to enhance their vertical industry targeting efforts:

  • Size the overall market within the bank’s footprint; identify clusters
  • Assess industry health and growth potential by analyzing key performance metrics (e.g., gross output, profitability, business formation and survival rates, international trade volume)
  • Identify unique financial needs, usage profiles and decision-making processes through a combination of primary and secondary research
  • Develop targeted marketing campaigns, to include tailored content as well as investments in industry-specific media (events, trade publications, online and social media sites)
  • Create, train and support dedicated industry teams; concentrate team deployment around clusters

Growth in U.S. Bank’s Commercial Loan Portfolios Continues to Slow

The FDIC recently published detailed bank data as of end-4Q13. This data revealed that U.S. banks are continuing to grow their commercial and industrial (C&I) loan portfolios, although the y/y growth rate has been steadily declining, from a high of 16% in 2Q12 to 7% in 4Q13. C&I loan portfolios declined significantly following the financial crisis, reaching a low of $1.2 trillion in 2Q10. Since then, C&I loan portfolios have grown 38%, and have driven overall U.S. loan growth.  The recent deceleration in the C&I loan growth rate had reduced the gap between C&I loan growth and overall net loan growth, from a high of 12.3 percentage points in 2Q12 to 3.7 percentage points in 4Q13.

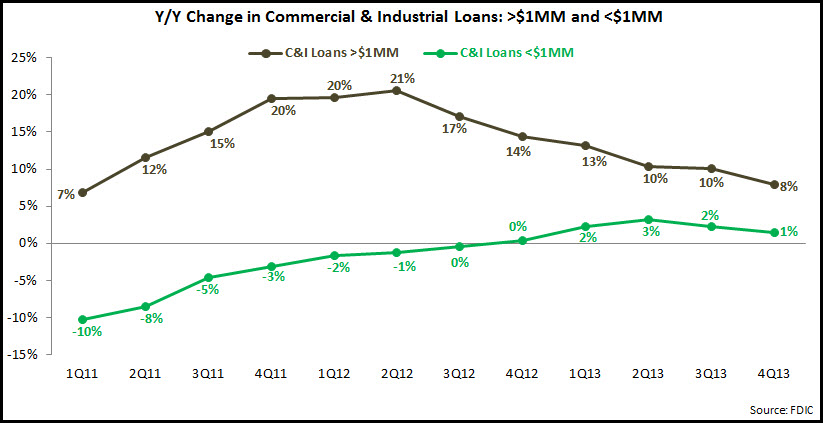
Within C&I loan portfolios, overall growth has been driven by individual loans valued at more than $1 million. Mirroring overall C&I loan portfolios trends, y/y growth for >$1MM loans peaked at 21% in 2Q12, and has been declining since then.  Meanwhile, small business loan portfolios (C&I loans with initial values of <$1 million) only started to report y/y growth at the end of 2012.  This growth rate reached 3% in 2Q13, but has slowed since, to 1.4% at the end of 2013. This slow recovery in small business lending has been due to both tight bank underwriting (which is only now beginning to ease), as well as low demand for small business loans due to uncertainty regarding the prospects for economic recovery. Interestingly, within this C&I loan <$1MM segment, strongest growth is being seen in the <$100K loan segment, which includes small business credit card loans. This <$100K portfolio rose 4.2% y/y in 4Q13, up from 2.9% in 3Q13.

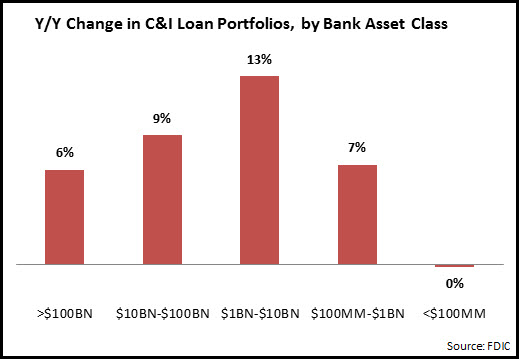
Strongest growth in C&I loans between end-2012 and end-2013 was reported by mid-sized banks with $1-$10BN in assets. The largest banks (>$100BN in assets) had trailed the industry average, as banks like JPMorgan Chase and Wells Fargo reported anemic loan growth. C&I loan portfolios for small community banks (<$100MM in assets) were unchanged y/y, as they struggle to compete with the broad commercial product range and cutting-edge online and mobile tools on offer from the larger banks.

Given the slowdown in the growth of C&I loan portfolios, how can individual banks continue to build their commercial loan portfolios?

  • Target specific geographic markets or vertical industry segments, where the bank already has—or can quickly create—dedicated capabilities
  • Re-commit to the small business segment
  • Develop initiatives to increase commercial loan utilization rates (which continue to trail historic averages for many banks)
  • Identify and dedicate resources to capture growth in other loan categories, which have been ignored in recent years

Top Credit Card Issuers’ 4Q13 Financials: Takeaways and Implications

A scan of 4Q13 and full-year 2013 financials for 13 leading U.S. credit card issuers revealed the following trends in outstandings, volume and credit quality:

Outstandings

Average outstandings continued to decline y/y for the top 4 issuers, but rose in other issuer categories:
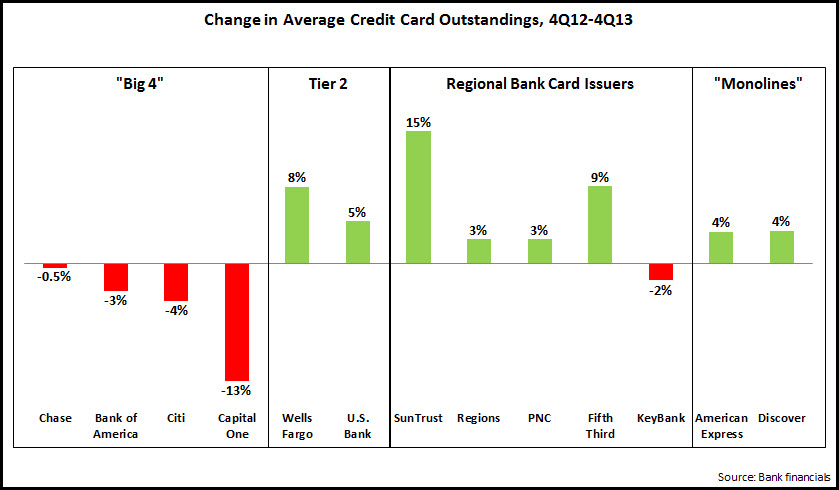
  • Although outstandings for the largest issuers continue to decline, there is evidence that these issuers are now at a inflection point, where growth in new vintages is starting to exceed declines in run-off portfolios.  Chase claimed that it reached this inflection point in the second quarter of 2013, and expects to generate moderate outstandings growth this year.  Bank of America is pointing to strong growth in account production, with 1 million new accounts opened in each of the past two quarters.
  • Discover and American Express both increased outstandings by 4% y/y; this led to net interest income growth, of 10% and 8%, respectively.
  • Wells Fargo grew average outstandings 8%, as it grew new accounts by 29% y/y .  Credit card penetration of Wells Fargo retail banking households rose from 27% in 1Q11 to 37% in 4Q13.

As there is growing consensus that the economy will grow robustly in 2014, improved consumer confidence should translate into increased credit appetite, which issuers will look to meet with targeted campaigns and pricing (on introductory rates rather than go-to APRs).  In addition, in recent years, issuers have focused on higher FICOs (which we discussed in a recent blog), but now may look to develop campaigns, product and pricing for other segments.

Volume

The 7 issuers reporting annual volume data generated an increase of 8% between 2012 and 2013.  Growth in volume continues to outstrip outstandings, as debt-wary consumers continue to see the credit card as more of a payment than a borrowing tool.

  • In general, issuers grew volume from a combination of new account production and increased existing cardholder spending.
  • American Express’ 9% growth was boosted by a 12% increase in small business spending, marking the fourth consecutive quarter of double-digit growth.

In 2014, issuers will be looking to benefit from growth in consumer spending as the economic recovery takes shape, so we should expect a continuation of tiered earnings in rewards programs, as well as communications and offers targeted at key stages of the cardholder life cycle (card acquisition, activation, retention and ongoing card usage).

Credit Quality

Charge-off rates for many issuers are at or below historic lows, with all issuers reporting 4Q13 rates below 4%.
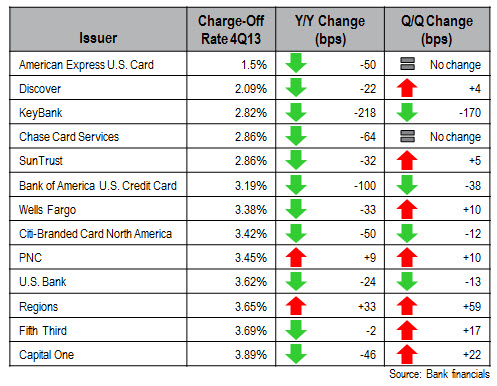
  • In the aftermath of the financial crisis, some of the leading issuers experienced huge spikes in their charge-off rates.  The charge-off rate for Bank of America’s U.S. Card unit rose to more than 14% in the third quarter of 2009, while the rate for Citigroup’s Citi-Branded Cards-North America unit peaked at 10.78% in 2Q10.  The chart above shows that charge-off rates for these issuers have returned to normal levels.
  • Low charge-off rates—and the expectation that these rates will remain low—enable issuers to maintain reduced loan loss provisions.  This in turn boosts profitability even as issuers struggle to grow revenues.  Some of the leading issuers reported strong y/y declines in provisions in 4Q13, including Chase (-46%) and American Express (-27%).

As issuers push for outstandings growth in 2014, the expectation is that charge-off rates will rise.  However, there are indications that rises in charge-off rates will be moderate.  30+ day delinquency rates (leading indicator for charge-off rates) continue to fall.  In addition, the credit card sector has changed fundamentally in recent years; neither consumers nor issuers see credit cards want to return to the borrowing/lending culture that pertained prior to the financial crisis.