Summarizing 2Q17 Credit Card Outstanding and Charge-Off Trends

In a recent blog post, EMI discussed growth trends in credit card outstandings and charge-off rates, and the importance of ensuring that both remain at manageable levels. Now, our analysis of 2Q17 financials for leading issuers, as well as the latest reports from the FDIC and FFIEC, reveal the following trends on these two key credit card metrics:

  • Issuers continue to report steady y/y growth in credit card outstandings, although the rate of growth has moderated in recent quarters. According to the FDIC’s Quarterly Banking Profile, credit card loans rose 4.5% to $780 billion. The growth rate was unchanged from the previous quarter, but marked a reduction from the 6%+ rates in the first three quarters of 2016.

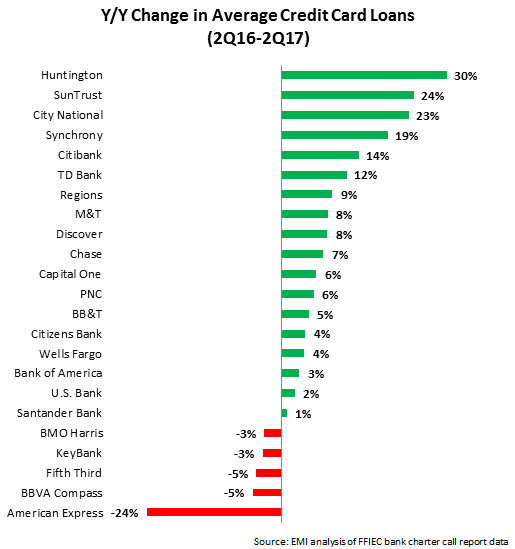
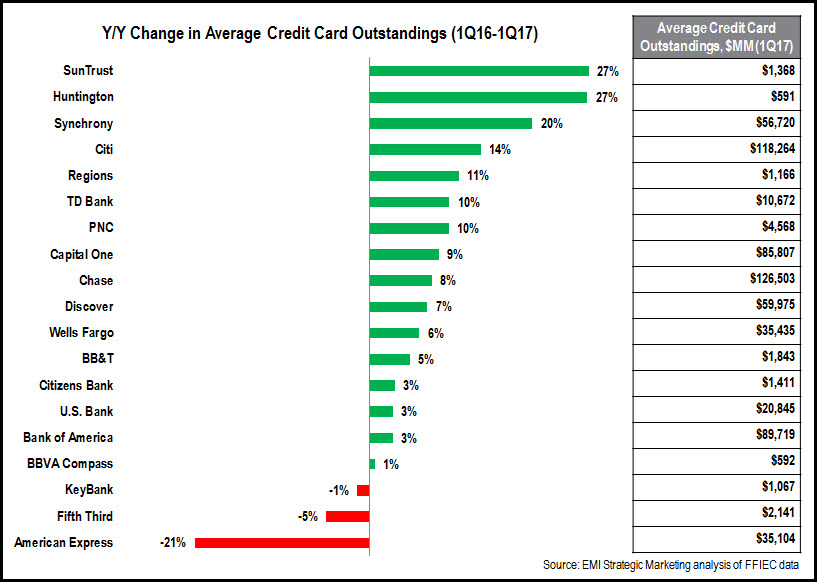
  • According to FFIEC call reports, regional bank card issuers like Huntington, SunTrust and City National reported the strongest y/y growth rates in credit card loans in 2Q17. Leading issuers also generated steady credit card loan growth: Citibank (+14% y/y, boosted by the acquisition of the Costco portfolio), Chase (+7%), Capital One (+6%) and Bank of America (+3%).

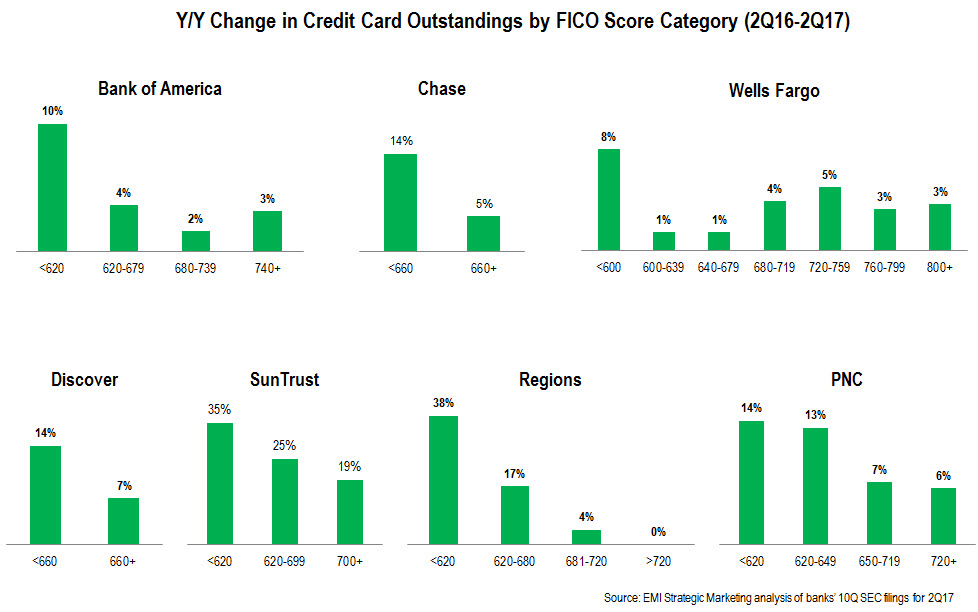
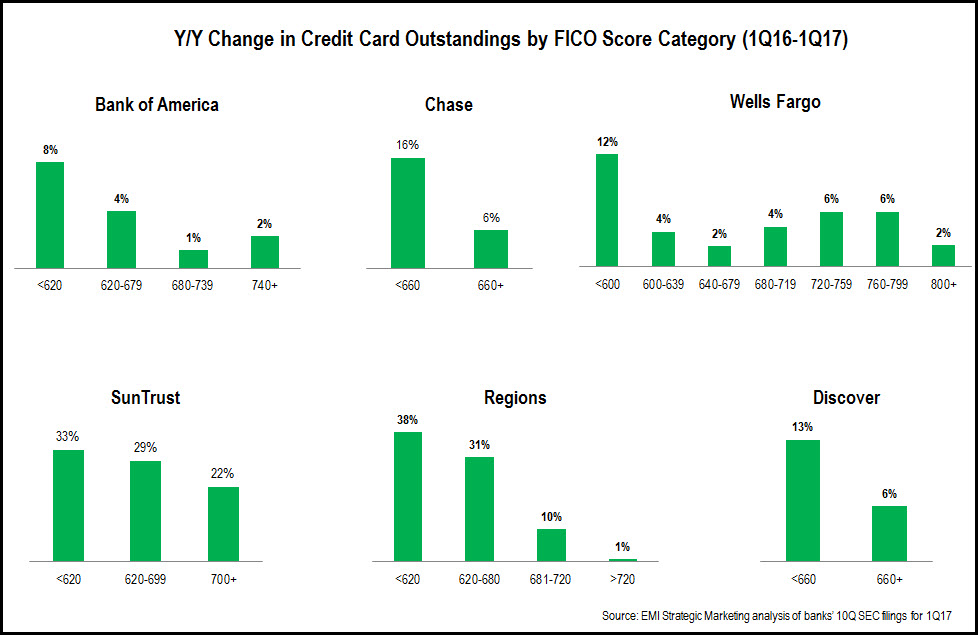
  • Leading issuers are growing credit card outstandings across the FICO Score spectrum.  Our analysis of selected credit card issuers’ 2Q17 10Q SEC filings found that issuers are reporting loan growth in all of their FICO Score segments, with most experiencing strongest growth in the sub-prime and near-prime categories. However, significant differences remain in the FICO Score composition of different card portfolios. For example, 35% of Capital One’s consumer credit card outstandings are held by people with a FICO Score of 660 or lower, but this segment only accounts for 12% of Chase outstandings and 14% of Citi’s portfolio.

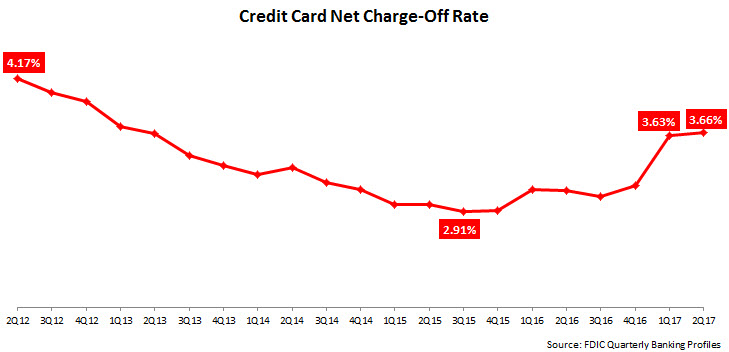
  • The rise in credit card outstandings is being mirrored by continued growth in net charge-off rates.  According to the FDIC Quarterly Banking Profile, the average charge-off rate was 3.66% in 2Q17. This marked a significant y/y rise of 55 basis points.  However, the rate was only up 3 bps from the previous quarter, indicating a slowdown in the growth trajectory. Moreover, the current rate remains low by historic standards.

Credit Card Issuers are Growing Outstandings…and Charge Offs

Most of the leading U.S. credit card issuers—portfolios of more than $500 million— reported y/y growth in their average credit card outstandings in the first quarter of 2017.

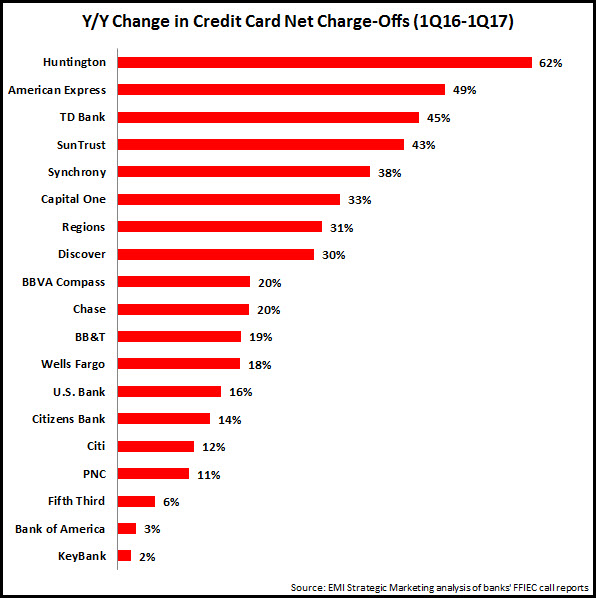
However, all of these issuers are also experiencing significant growth in credit card net charge-offs (gross charge-offs minus recoveries).  Of the 19 issuers:

  • 10 reported y/y charge-off increases of more than 20%.
  • For 17, charge-off rises outpaced outstandings growth.

These recent significant increases in charge offs follow an extended period of declining charge-off rates in the aftermath of the 2008-9 Financial Crisis.  During the 2010-2015 period, issuers tightened up their credit card underwriting considerably, and consumers moved away from racking up high levels of credit card debt.  According to the FDIC, the credit card net charge-off rate fell from a recessionary high of more than 13% in 1Q10 to less than 3% in 3Q15.  Since then, the rate rose slightly—to 3.16% in 4Q16—but still well below levels seen prior to the Financial Crisis.  And five of the issuers in the chart above (Chase, Bank of America, Discover, BB&T and SunTrust) still had net charge-off rates of less than 3% in 1Q17.

Even though current charge-off rates are low by historic averages, issuers must be careful not to allow charge-off momentum to grow to a problematic level.  One area of potential concern: many leading credit card issuers are reporting strongest outstandings growth for their low FICO Score segments, which tend to have significantly higher credit risk profiles.

Of course, when focusing on growing credit card loans, issuers accept that charge offs will rise.  However, they can help to ensure that these charge offs remain at a manageable level by:

  • Maintaining underwriting discipline
  • Avoiding a race to the bottom in credit card pricing; it’s notable that, according to CreditCards.com, the average credit card APR reached a record high of 15.80%)
  • Providing content and tools to educate consumers on how to use credit cards responsibly
  • Continuing to market credit cards as both payment tools and sources of credit

Banks Seek to Leverage Surveys to Build Small Businesses Engagement

In recent weeks, a range of leading national and regional banks have carried out small business surveys, many of which were timed to coincide with 2017 National Small Business Week (April 30-May 6). These include new surveys from Citizens Bank (Small Business Pulse) and Fifth Third Bank.

These surveys are designed to:

  • Generate brand awareness among small business owners
  • Underline the bank’s commitment to this market
  • Position the bank as a thought leader in the small business space
  • Promote the bank’s small business solutions

The following are six approaches that banks are using to leverage small business surveys to drive engagement with their small business clients and prospects:

  1. Establish a branded index.  Many banks measure small business optimism via an index. This enables them to both track this metric over time, as well as generate general business press attention. Citizens recently-published survey includes the Citizens Business Pulse Index, which is its measure of the small business climate. Other indexes include the Wells Fargo/Gallup Small Business Index and the Capital One Small Business Growth Index.
  2. Create a recurring survey. Many of the leading banks now conduct surveys on a quarterly, biannual or annual basis, which enables them to track small business metrics over time. Capital One has been tracking a Small Business Confidence Score consistently since 2008.
  3. Survey topics of interest. Most surveys focus on small business optimism and outlook. However, surveys also look to differentiate by covering other issues that should be of interest to small businesses. The U.S. Bank Small Business Annual Survey studies small business owners’ personal satisfaction as well as the desired attributes they want from their business bank.
  4. Use infographics to summarize survey findings. Presenting key findings from the survey (which will typically include a series of statistics) in a visually-appealing format allows readers to quick grasp important points the bank wants to make. Wells Fargo published a lengthy survey report, but it also created a one-page infographic that summarizes key takeaways.
  5. Version the survey for target marketsBank of America creates versions of its Business Advantage Small Business Owner Report for 10 target markets (Atlanta; Boston; Chicago; Dallas/Fort Worth; Houston; Los Angeles; New York; Miami; San Francisco; and Washington, D.C.). Similarly, PNC publishes its Spring Economic Outlook Survey findings for 10 regional markets.
  6. Position the bank (subtly) as a small business solutions providerFifth Third’s recent small business survey included findings on funding growth, while also positioning the bank as “committed to the development of small businesses throughout the Bank’s footprint.