The Measure of Success in Customer Success

If you listen to Customer Success Management professionals talk about what they do, you’ll get the message loud and clear. In order to be viewed as a growth engine rather than a cost center, the CSM must move beyond being firefighters, which relegates the CSM function to the world of support – helpful, but totally reactive. Just because it is part of the story of how many CSM teams got started doesn’t mean that it needs to be part of how the CSM team is positioned going forward.

I’d like to take things one step further. I believe that success for CSM can be defined as the day that Success managers and executives no longer talk at all about how many customer relationships they and their team have “saved.” I understand the motivation – it’s a tangible demonstration of the value of their function and one that explicitly and clearly relates to the activities of the CSM team. However, there are three problems with ”saved customer” refrain:

  1. It continues the focus on reactive impact, as saving implies that the customer was “at risk” until the successful intervention of the CSM team.
  2. It undervalues the total impact of CSM on the top line because it doesn’t account for up-sell or cross-sell revenue and on the bottom line because, among other things, it doesn’t account for the lowering of customer acquisition costs through advocacy and word-of-mouth.
  3. Finally, why should saving customers even be necessary? The strategic, pro-active approach of the CSM team should ensure that customers are kept on a path to value and rarely or never get diverted to end up at risk.

Not only does talk of saves do a poor job of positioning the CSM team within the organization, it has the potential to create or foster antagonism between CSM and other functions. The need to save results from some misstep, whether by marketing or sales in poorly setting expectations, product development in delivering an application with feature shortcomings or bugs, or support in failing to respond to requests quickly or thoroughly enough. Does the CSM team really want to be the nagging parent of the organization that always talks about cleaning up everyone else’s mess?

While we’re at it, maybe we should do away with the outward focus on “churn rate.” Talking about CSM in terms of churn still mires it in a framework of prevention rather than expansion and growth. Every customer relationship is an opportunity for growing revenue through renewal, upsell, cross-sell, and advocacy. So why not refer to the performance of the CSM team responsible for managing and nurturing those relationships in terms of conversion of that revenue opportunity? Sales isn’t measured by their loss rate (yes, win/loss is an element of sales performance analysis but it’s rarely the primary sales measure mentioned), but rather by their bookings against quota or their conversion rate. I’m not suggesting that churn should be ignored or even that it not be a/the primary measure used internally by the CSM team. Rather, I’m suggesting that perhaps CSM does itself a disservice and perpetuates the stale paradigms that it is trying to shift by highlighting “saves” to the non-CSM world.
 

Top Credit Card Issuers’ 4Q13 Financials: Takeaways and Implications

A scan of 4Q13 and full-year 2013 financials for 13 leading U.S. credit card issuers revealed the following trends in outstandings, volume and credit quality:

Outstandings

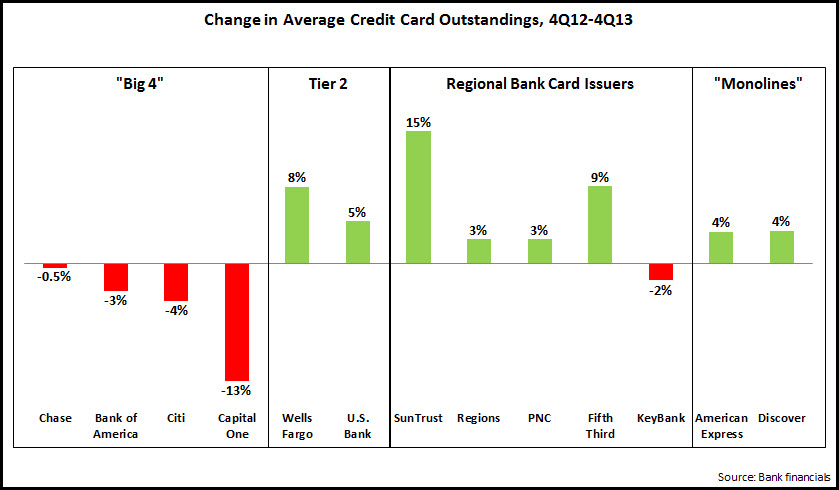
Average outstandings continued to decline y/y for the top 4 issuers, but rose in other issuer categories:

  • Although outstandings for the largest issuers continue to decline, there is evidence that these issuers are now at a inflection point, where growth in new vintages is starting to exceed declines in run-off portfolios.  Chase claimed that it reached this inflection point in the second quarter of 2013, and expects to generate moderate outstandings growth this year.  Bank of America is pointing to strong growth in account production, with 1 million new accounts opened in each of the past two quarters.
  • Discover and American Express both increased outstandings by 4% y/y; this led to net interest income growth, of 10% and 8%, respectively.
  • Wells Fargo grew average outstandings 8%, as it grew new accounts by 29% y/y .  Credit card penetration of Wells Fargo retail banking households rose from 27% in 1Q11 to 37% in 4Q13.

As there is growing consensus that the economy will grow robustly in 2014, improved consumer confidence should translate into increased credit appetite, which issuers will look to meet with targeted campaigns and pricing (on introductory rates rather than go-to APRs).  In addition, in recent years, issuers have focused on higher FICOs (which we discussed in a recent blog), but now may look to develop campaigns, product and pricing for other segments.

Volume

The 7 issuers reporting annual volume data generated an increase of 8% between 2012 and 2013.  Growth in volume continues to outstrip outstandings, as debt-wary consumers continue to see the credit card as more of a payment than a borrowing tool.

  • In general, issuers grew volume from a combination of new account production and increased existing cardholder spending.
  • American Express’ 9% growth was boosted by a 12% increase in small business spending, marking the fourth consecutive quarter of double-digit growth.

In 2014, issuers will be looking to benefit from growth in consumer spending as the economic recovery takes shape, so we should expect a continuation of tiered earnings in rewards programs, as well as communications and offers targeted at key stages of the cardholder life cycle (card acquisition, activation, retention and ongoing card usage).

Credit Quality

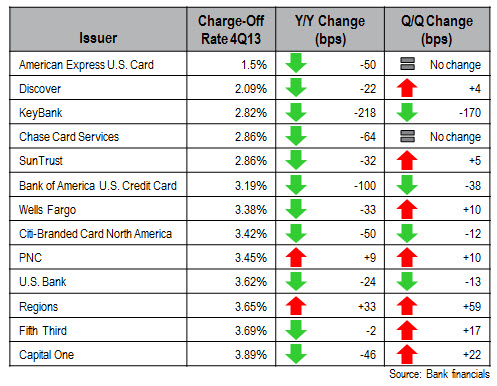
Charge-off rates for many issuers are at or below historic lows, with all issuers reporting 4Q13 rates below 4%.

  • In the aftermath of the financial crisis, some of the leading issuers experienced huge spikes in their charge-off rates.  The charge-off rate for Bank of America’s U.S. Card unit rose to more than 14% in the third quarter of 2009, while the rate for Citigroup’s Citi-Branded Cards-North America unit peaked at 10.78% in 2Q10.  The chart above shows that charge-off rates for these issuers have returned to normal levels.
  • Low charge-off rates—and the expectation that these rates will remain low—enable issuers to maintain reduced loan loss provisions.  This in turn boosts profitability even as issuers struggle to grow revenues.  Some of the leading issuers reported strong y/y declines in provisions in 4Q13, including Chase (-46%) and American Express (-27%).

As issuers push for outstandings growth in 2014, the expectation is that charge-off rates will rise.  However, there are indications that rises in charge-off rates will be moderate.  30+ day delinquency rates (leading indicator for charge-off rates) continue to fall.  In addition, the credit card sector has changed fundamentally in recent years; neither consumers nor issuers see credit cards want to return to the borrowing/lending culture that pertained prior to the financial crisis.

Banks Reducing Marketing Intensity

An analysis of 4Q13 and full-year 2013 financial results for the leading U.S. banks reveals that most are continuing to reduce their marketing spend.  This is being driven by both economic uncertainty as well as banks’ long-term desire to cut costs and maintain profitability as they struggle to generate revenue growth.

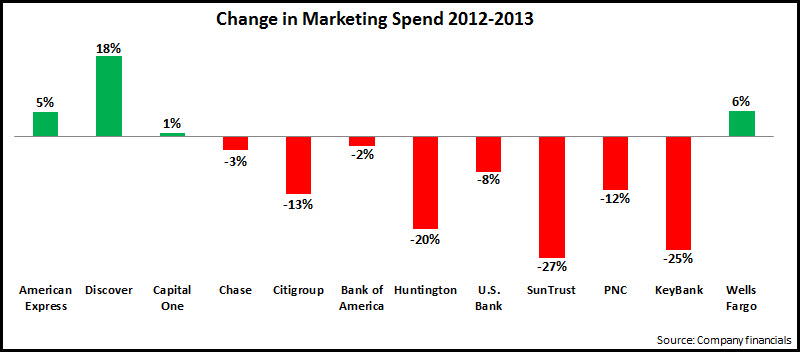
  • Of the 12 banks studied, 8 reduced marketing spend between 2012 and 2013, with 5 of these cutting budgets by more than 10%.

  • Taking a longer term view, 8 of the 12 banks increased their marketing expenditure between 2008—when the financial crisis hit—and 2013.

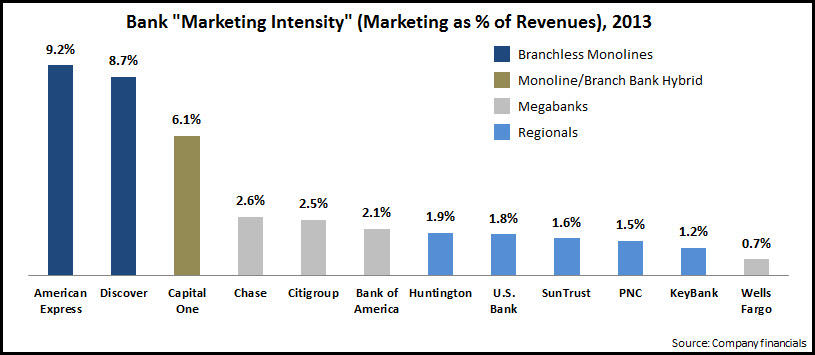
At first glance, this would imply that banks have ramping up their marketing spend in recent years.  However, many of these banks have changed dramatically during this period, mainly through acquisition.  For example, Wells Fargo acquired Wachovia, Chase bought Wamu, and PNC purchased both National City and RBC Bank.  So, to ensure that we are comparing like-with-like, we need to look at “marketing intensity”, which we define as the ratio of marketing spend to net revenue.

  • In 2013, there was a broad disparity in intensity for the various bank categories: highest marketing intensity (>8% of revenues) for branchless monolines, which have no branch networks and which are overwhelming focused on selling credit cards; lowest intensity for regionals (<2% of revenues); and megabanks tend to spend 2-3% of revenues on marketing, with the notable exception of Wells Fargo.  Capital One is a monoline/branch bank hybrid, with a branch network but also a continued high dependency on credit cards; this is reflected in the 6% of revenue it devotes to marketing, higher than traditional branch banks, but lower than monolines.

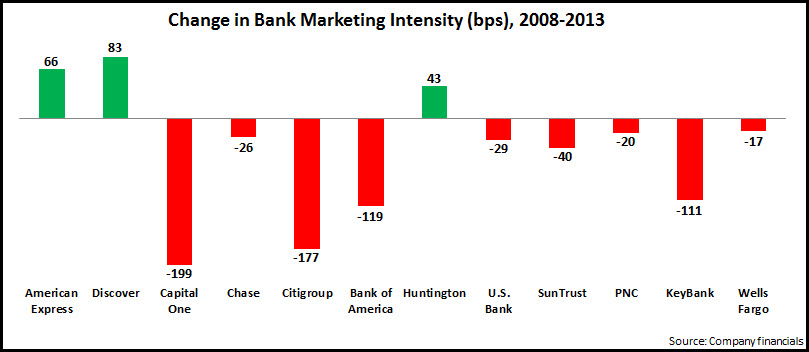
  • So, even though 8 of the 12 banks increased their marketing expenditure between 2008 and 2013, during this period, 9 of the 12 banks reduced their marketing intensity levels.  It is notable that the two “banks” with the highest marketing intensity—American Express and Discover—have both increased in intensity over the past five years.  On the other hand, the largest decline was recorded by Capital One, which has been transforming itself from its credit card monoline to full-service bank.

As there are now signs that economic recovery is gaining strength, increases in consumer and business confidence should translate into a greater demand for financial revenues and opportunities for banks to grow revenues.  However, the need for increased marketing investment to capture business growth will be battling against banks’ cost-cutting culture that has become in recent years.