Most of the leading U.S. banks highlighted continued robust C&I loan growth in their most recent financials. Recently-published data from FDIC provides C&I loan data for all of the 7,200 U.S. banks, enabling us to develop a more comprehensive picture of overall changes in C&I lending, as well as making comparison between different bank-size categories.
The following are some topline takeaways from an EMI Strategic Marketing, Inc. analysis of the FDIC C&I loan data:
- C&I loan portfolios for all FDIC-insured banks rose 18% year-over-year, to more than $1.4 trillion at the end of 2Q12
- Looking at different C&I loan-size categories, the portfolio of loans of more than $1 million jumped 23% y/y. However, the portfolio of loans of less than $1 million grew by only 2%.
- Within the C&I loans of <1MM category, strongest growth was for <$100K loans (mainly business credit card loans), which rose 5% y/y
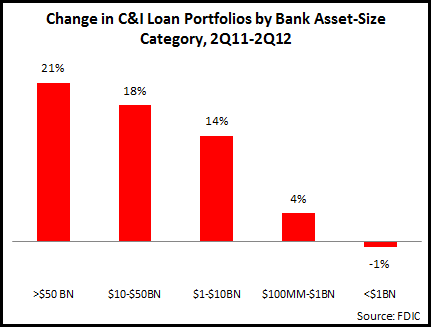
- Continuing a trend seen in recent quarters, the larger banks (>$50 billion in assets) had the strongest y/y rise in overall C&I loans.
- Banks in the $50BN+ asset category that drove this growth included: JPMorgan Chase (+30%), Citibank (+27%), PNC (+25%), SunTrust(+24%), and U.S. Bank (+23%)
- Reflecting the trend in overall C&I loans, the largest banks had the strongest growth in small business loans (of <$100K).


