Making Use of Data: 5 Questions Marketers Need to Answer to Succeed

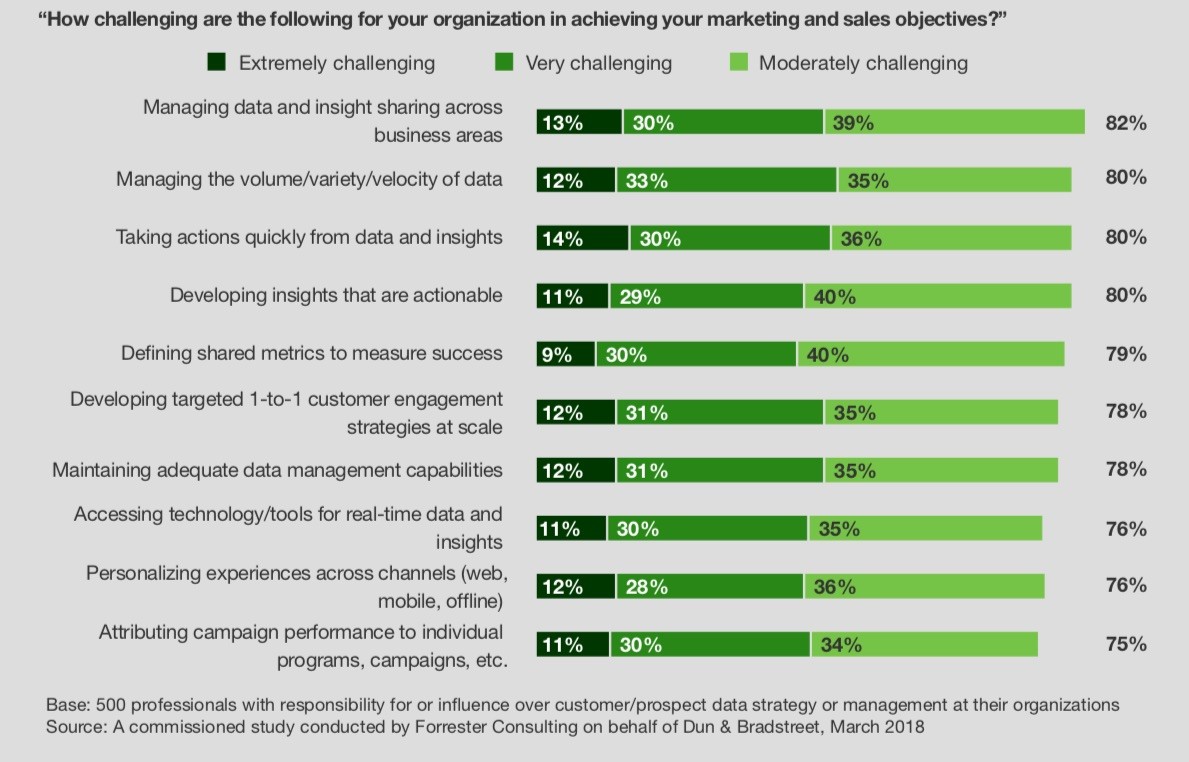
A recent Forrester/Dun and Bradstreet survey revealed that only about half of sales and marketing decisions at B2B companies with over 500 employees are made based on data. The following summary from MarketingProfs shows that challenges to the effective use of data abound: From gathering to application to measurement, all are seen as either “extremely” or “very” challenging by a large portion of the respondents.

The paradox here is that businesses are awash in data today. Companies are spending vast amounts on software, hardware, and services related to data acquisition, management, and display. Moreover, businesses are constantly talking about data and the need to make better use of it. Unfortunately, neither these solutions nor the organizational desire solves the problem. In fact, the solutions often make the problem worse because they are seen (and sold) as a silver bullet and enable managers to check a box saying they are pursuing a “data initiative.”

The reality is that the problem lies not in a lack of will or technology. It lies in a lack of focus—a lack of strategy around data management and analytics. When you can measure anything, you do…but more measures mean more data and more difficulty making it all align. More data also mean more potential interpretations—and a decreased likelihood of consensus around what the data mean and the implications.

To construct an effective data and analytics strategy, marketers need to answer the five questions below. You’ll see that several are much more about strategy than data. Why? Because to capture and leverage the right data, we must first be clear on strategy.

  • What are the key stages of the customer journey? The point of marketing and sales is to influence behavior towards revenue generation. If you don’t know the path customers will follow that will generate revenue, what good is your data?
  • What activities are we undertaking today to move people through those stages? Marketing and sales should be targeting points on the customer journey with activities designed to influence behavior. Organizing activities along the journey ensures that you will use data about those activities and customers in the right way.
  • What should be the measure(s) of success for the impact these activities are having? Once you have aligned activities with the journey, identify ways of assessing whether those activities are successful, specifically with respect to the goal of moving from one stage to the next.
  • How can we align data we have or could plausibly get with these measures? Effectively using data to make decisions depends on being able to capture the right data consistently and with confidence. If it’s hard to acquire data or the data is subject to skepticism in the organization, it will never be used.
  • What decisions will we make based on the data? Imagine if, for a given measure or data point, one month it’s high and the next month it’s low. What decision will that trigger? If you can’t articulate the decision that will flow from the data, why capture the data in the first place?

To be clear, answering these questions is NOT easy for most companies. Data strategy isn’t easy. It’s actually much harder than buying software or hiring consultants to deliver more data and more measures through more systems. But without that hard work to decide what data and what measurements can really impact business outcomes, it’s unlikely that surveys like the one above will show any better results.

Leading U.S. Banks Report Modest Increase in Marketing Budgets in 2017

Marketing spend by the top 40 banks reached nearly $14 billion in 2017, up 1.8% on average from the previous year–and once again, 5 banks spent over a billion dollars on marketing. EMI analysis of bank spending reveals:

  • 30 of the 40 largest banks grew marketing spend in 2017, with 17 reporting double-digit growth.
  • As in past years, banks with national credit card franchises lead all others, in both absolute terms and in their marketing intensity (marketing spend relative to revenues). In 2017, spending among these card leaders declined, as focus shifted from acquisition to portfolio marketing.
  • Two banks notable for substantial 2017 marketing increases are Goldman Sachs Bank focused on promotion of its online lending platform, Marcus by Goldman Sachs, and U.S. Bank capitalizing on brand-building around the Super Bowl, held last week at the Minneapolis stadium bearing the bank’s name.

EMI annual analysis of Federal Financial Institutions Examinations Council (FFIEC) call report data for 40 leading U.S. banks distills both absolute spending and marketing intensity ratios, as measured by spend percentage of net revenues (net interest income plus noninterest income).  Results are reported below.

Advertising and Marketing Spending Highlights

19 banks/bank charters had advertising and marketing budgets of more than $100 million.  5 had billion-dollar-plus budgets (JPMorgan Chase, American Express, Capital One, Citigroup and Bank of America).

Of the 17 banks reporting double-digit growth, the two with the largest absolute increases in their marketing budgets were:

  • U.S. Bank: +$107 million, with a focus on growing national profile behind the increased marketing spend, including heavy branding around the Super Bowl, which was held last Sunday at the U.S. Bank Stadium in Minneapolis.
  • Goldman Sachs Bank: +$80 million, driven by an advertising campaign to promote Marcus by Goldman Sachs, its online personal lending platform.
  • First Republic was also notable for its 46% increase–a strategy that seems to have paid off with 18%+ revenue growth reported by the San Francisco-based bank in 2017.

Other banks boosted marketing spend to support new campaigns in 2017.

  • Fifth Third (+10% to $115 million) launched a campaign in May 2017 that played on its “5/3” name, promoting “Banking that’s a Fifth Third Better”
  • BB&T (+10% to $89 million) introduced a new brand campaign and tagline (“All we see is you”) in September 2017.
  • SunTrust (+38% to $220 million) rolled out its ‘Confidence Starts Here’ ad campaign in March 2017, building on its onUp movement focused on building financial well-being.

Marketing spend declines were led by:

  • Capital One: decline of $139 million, with a strong drop in spending in its card unit partially offset by a $23 million rise in its retail banking unit.
  • American Express: down $111 million, although this follows a ramp up of marketing and promotion spending in recent years.  American Express is also increasing its focus on targeting existing clients, which typically involves lower marketing spend.

Marketing Intensity Highlights

Even though 30 banks increased their marketing budgets in 2017, only 14 increased their bank marketing ratios, meaning that growth in marketing spend did not match the rise in net revenues.  Banks with the strongest growth in their marketing ratios were Goldman Sachs Bank (+183 basis points), SunTrust (+61 bps) and U.S. Bank (+44 bps).

Most retail banks have marketing ratios of 1-3%. Those with the highest marketing ratios include Santander Bank (4.1%, due to continued growth in the bank’s U.S. marketing budgets in recent years) and BMO Harris (3.4%, following a 17% rise in marketing spend in 2017).  4 banks have marketing ratios of less than 1%.  Most notable in this category is Wells Fargo, which has traditionally–and infamously–focused on sales and required much lower advertising budgets than its peers.  Wells Fargo did launch a new integrated marketing campaign in April 2017, which it reported was focused on “rebuilding trust.”  This contributed to a 4% rise in its advertising and marketing budget in 2017, but its spend levels remain well below comparably-sized banks.

We expect that banks will maintain or even increase their marketing budgets in 2018 to build brand awareness and affinity, as well as to promote new products and services–in particular those focused on digital transformation.  However, many banks remain focused on improving efficiency ratios, and marketing budgets are often on the firing line when banks look cut costs.  However these cuts–when executed without a careful strategy for maximize marketing ROI–often sacrifice market share gain and longer-term growth.

Banks ramp up advertising and marketing spend in 2016

According to EMI Strategic Marketing’s analysis of data from the Federal Financial Institutions Examination Council (FFIEC), U.S. banks spent $17.1 billion on advertising and marketing in 2016.  This expenditure represented 2.4% of bank revenues. Five banks (JPMorgan Chase, American Express, Citigroup, Capital One and Bank of America) each spent more than $1 billion, and together accounted for more than half of the industry’s total expenditure. The following chart looks at 2016 marketing-to-revenue ratios for 20 leading U.S. banks (note that for JPMorgan Chase and Capital One, marketing spend data is provided for both their retail bank charters and card-issuing units).

bank_marketing_spend_2016

Most banks grew their marketing spending in 2016, as they looked to drive revenue growth in an improving economy.  10 banks reported double-digit percentage rises in their advertising and marketing budgets.  In some cases (e.g., KeyBank and Huntington), the strong increases were in part the result of significant bank acquisitions.

13 banks grew their marketing-to-revenue ratios in 2016.

  • Half of the banks in the chart (mostly branch-based banks) have marketing-to-revenue ratios of between 1.5% and 3%.
  • Several banks have been ramping up their marketing spend in recent years.  Between 2014 and 2016, Santander Bank’s spend nearly doubled between 2014 and 2016, and its 2016 marketing-to-revenue ratio of 4.0% was the highest among branch-based banks.
  • At the other end of the scale, both Wells Fargo and BB&T have ratios consistently below 1%.

Credit card-focused banks/bank charters have the highest marketing-to-revenue ratios.

  • Chase Bank USA (JPMorgan Chase’s card-issuing bank) had a ratio of almost 20% in 2016.  The sharp rise in the ratio from 2014 and 2015 was due to both a 6% rise in advertising and marketing spend (to support the launches of Freedom Unlimited and Sapphire Reserve), as well as a sharp decline in noninterest income.
  • American Express increased in its advertising and marketing spend by 15% in 2016, and its ratio rose to nearly 12%.

As banks look to scale back their branch networks both to save costs and adapt to changing bank channel usage (in particular for everyday banking transactions), they are also cognizant of the potential loss of the branch’s role as a branding beacon in local markets.  Therefore, it’s likely that a portion of the cost savings from branch network reductions will be diverted to advertising and marketing budgets.  As a result, we may expect banks’ marketing-to-revenue ratios to gradually increase in the coming years.