FDIC bank data shows continued C&I–and even some small business–loan growth

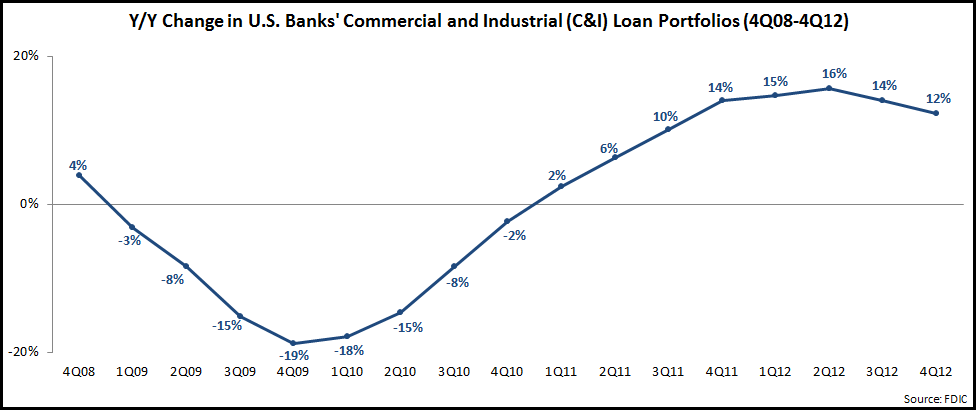
This week, the FDIC published end-4Q12 data for all U.S. banks showing that U.S. banks’ commercial and industrial (C&I) loan portfolios rose 12% in the year to end-4Q12.  This marks the sixth consecutive quarter with double-digit y/y growth, although the rate of increase has fallen from a high of 16% in 2Q12.
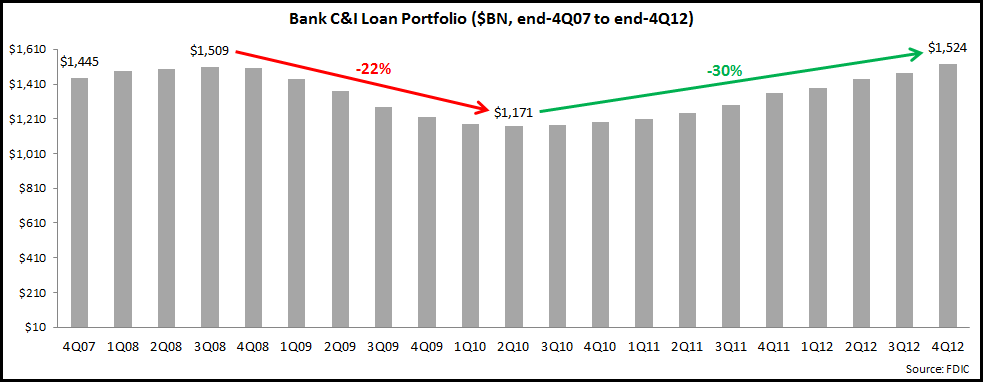
Banks are increasingly looking to commercial lending as a way to grow their overall business, but they are concerned that the current growth rate can be sustained, in particular given the precarious nature of the U.S. economic recovery.  The following chart shows that the strong growth rates over the past two years has resulted in C&I loan portfolios returning to levels seen just prior to the financial crisis.
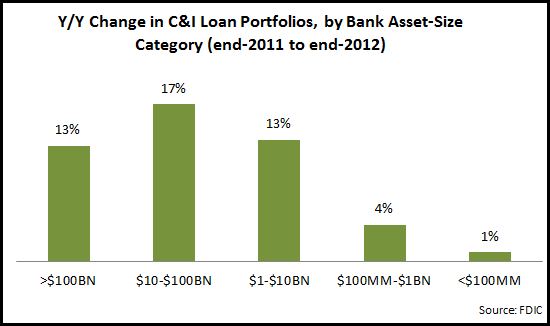
The data also shows a market difference in C&I loan portfolio growth performance by different bank-asset classes, with larger banks significantly outperforming those with less than $1 billion in assets.

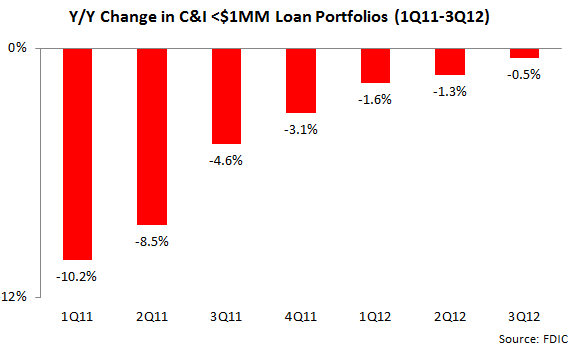
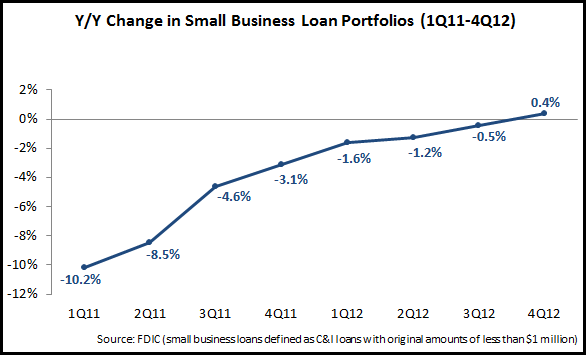
Although banks’ C&I loan portfolios have recovered strongly in recent years following the financial crisis, small business loan portfolio growth remains elusive.  The FDIC started to report small business loan data in 1Q10, and since then small business loan portfolios have decreased by 10%.  However, there are signs that this period of decline has finally bottomed out, with a y/y increase of 0.4% at the end of 2012.

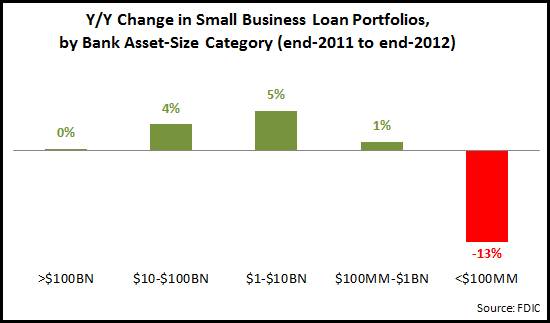
As with their overall C&I loan portfolios, larger banks–led by banks with $1-$10 billion in assets–reported strongest small business loan portfolio growth, while community banks with less than $100 million in assets saw a 13% y/y decline in their small business loan portfolios.
Driving Commercial Loan Growth Through Vertical Industry Targeting

Recently-published data from the Federal Reserve indicates that U.S. banks’ C&I loan portfolios continued to grow strongly on a year-on-year (y/y) basis in 4Q12.  This industry-wide view is supported by C&I loan data that appeared in quarterly financial results from individual banks.  However, these quarterly financials also indicated a continued decline in commercial loan yield, indicating that the commercial loan market is becoming increasingly competitive.

So, how can banks continue to differentiate themselves from their competitors and continue to grow commercial loans, while maintaining margins?  One strategy being pursued by an increasing number of banks is vertical industry targeting.

Several banks already following this strategy reported strong growth in industry-specific commercial loan portfolios in 2012:

  • Comerica grew average commercial loans 17% year-on-year in 4Q12, but enjoyed well above-average loan growth rates in energy (+46%), environmental services (+31%). and tech and life sciences (+24%).
  • TD Bank’s included data on gross loans by industry sector in its 4Q12 financials,which highlighted very strong y/y growth growth in health and social services (+30%), professional and other services (+25%), and government/public sector (+21%).

A number of other banks launched targeted industry initiatives in 4Q12:

  • Fifth Third launched an energy lending unit in October 2012, and reported that energy accounted for 12% of new C&I loan production in 4Q12.
  • Associated Bank introduced a Healthcare Industry Banking group in November 2012
  • Also in November 2012, Huntington Bank launched energy lending and agribusiness initiatives.  In reporting 4Q12 financials, Huntington pointed to strength in its manufacturing, healthcare and energy sectors

If your bank is thinking about pursuing a vertical industry strategy, the following are some important considerations:

  • Size the number and composition of firms in the targeted industry within the bank’s footprint.
  • Conduct primary research to understand market characteristics, financial needs and purchase decision-making dynamics.
  • Deploy a dedicated team to develop and implement targeted industry initiatives.
  • Create a communications plan, including developing a presence in key industry media (offline and offline trade publications, social media, events) as well as incorporating industry messaging into key bank channels, such as branch and Internet (it is notable that, of the 20 banks with the largest C&I loan portfolios, 15 have industry-specific sections on their websites).
  • Develop partnerships with national and local industry associations.

U.S. C&I Loan Trends in Latest FDIC Data

A recent EMI blog post highlighted commercial loan portfolio trends in the third quarter 2012 financial results for leading U.S. banks.  Building on this, EMI analyzed recently-published FDIC data to gain insights into commercial loan portfolio trends for all U.S. banks:

  • Larger banks are generating stronger C&I loan growth than smaller banks.  According to the FDIC, total C&I loans rose 15% between end-3Q11 and end-3Q12.  Banks with more than $1 billion in assets increased C&I loans by 16%.  Banks with less than $1 billion in assets grew C&I loans by only 3% (banks with less than $100MM in assets actually reported a 1% decline in C&I loans).

  • Larger banks have a higher C&I loan concentration. C&I loans account for 20% of total U.S. bank net loans.  Not surprisingly, C&I loan concentrations are higher in banks with more than $1 billion in assets (21%) than in banks with less than $1 billion in assets (13%).
  • Declines in small business loan portfolios are starting to bottom out. Small business loan portfolios (defined as C&I loans of less than $1 million) fell by 0.5% in the year to end-3Q12.  However, the rate of decline has been slowing, as originations/renewals start to catch up with charge-offs/expirations.